matplotlib.pyplot.show#
- matplotlib.pyplot.show(*, block=None)[source]#
Display all open figures.
- Parameters:
- blockbool, optional
Whether to wait for all figures to be closed before returning.
If
Trueblock and run the GUI main loop until all figure windows are closed.If
Falseensure that all figure windows are displayed and return immediately. In this case, you are responsible for ensuring that the event loop is running to have responsive figures.Defaults to True in non-interactive mode and to False in interactive mode (see
pyplot.isinteractive).
See also
Notes
Saving figures to file and showing a window at the same time
If you want an image file as well as a user interface window, use
pyplot.savefigbeforepyplot.show. At the end of (a blocking)show()the figure is closed and thus unregistered from pyplot. Callingpyplot.savefigafterwards would save a new and thus empty figure. This limitation of command order does not apply if the show is non-blocking or if you keep a reference to the figure and useFigure.savefig.Auto-show in jupyter notebooks
The jupyter backends (activated via
%matplotlib inline,%matplotlib notebook, or%matplotlib widget), callshow()at the end of every cell by default. Thus, you usually don't have to call it explicitly there.
Examples using matplotlib.pyplot.show#


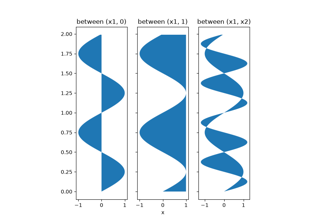


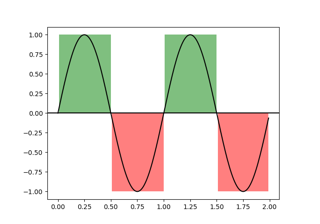
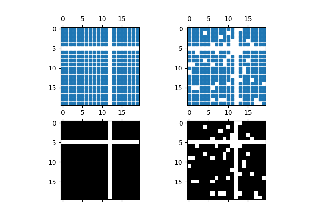
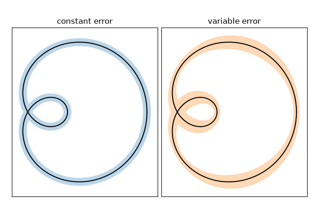
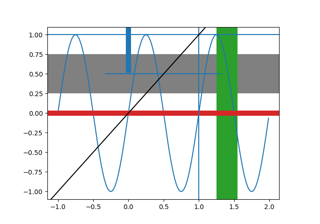
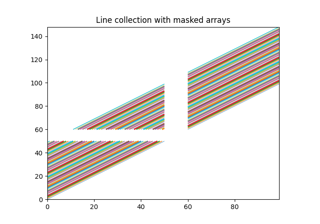
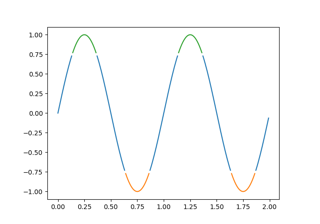
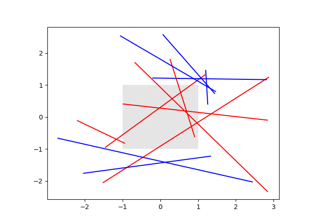
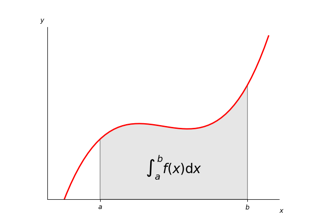
Shade regions defined by a logical mask using fill_between


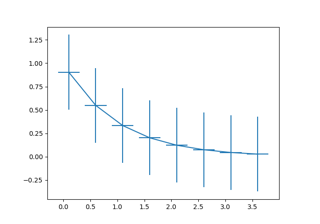


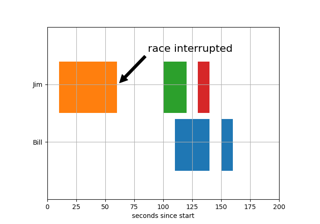
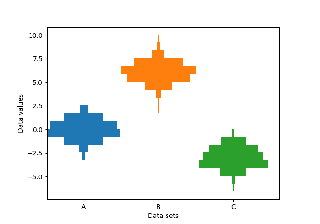
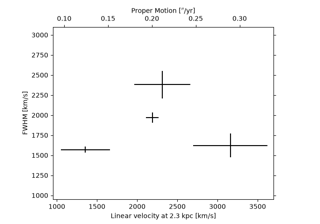
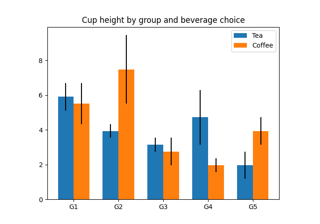
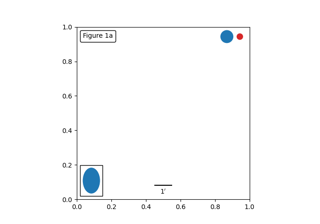
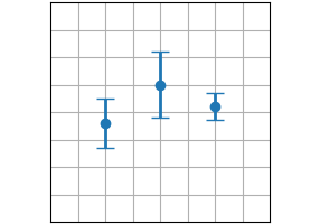
Create boxes from error bars using PatchCollection
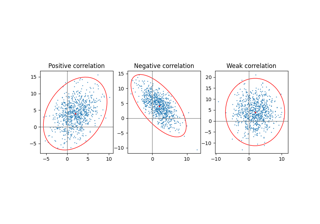
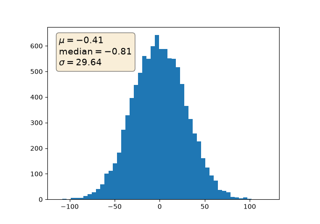
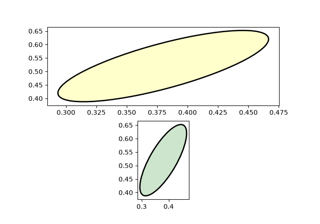
Plot a confidence ellipse of a two-dimensional dataset


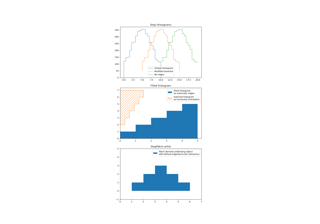
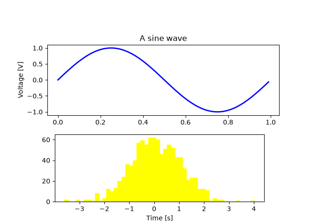
Demo of the histogram function's different histtype settings


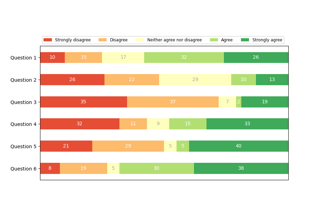
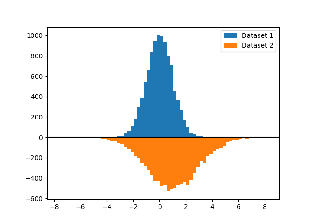
The histogram (hist) function with multiple data sets


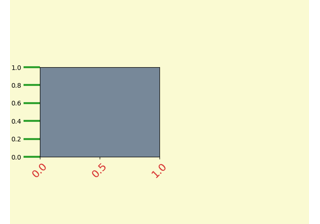
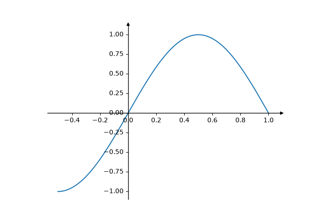
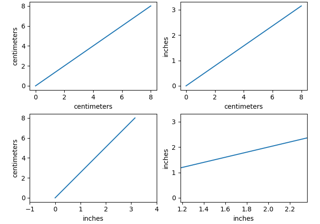
Controlling view limits using margins and sticky_edges


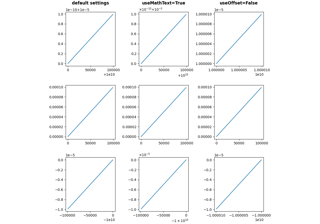
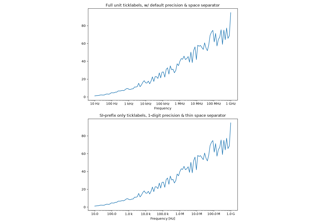

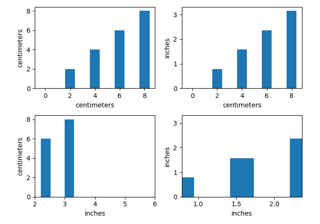
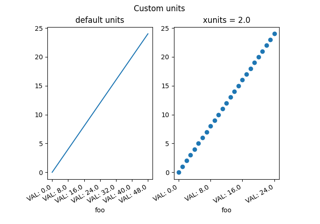
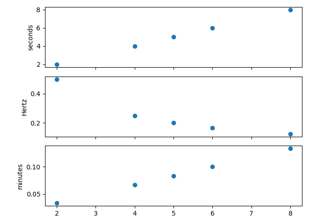
SI prefixed offsets and natural order of magnitudes


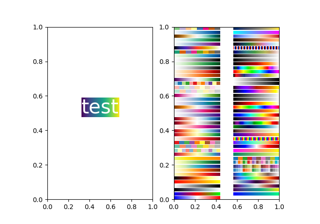
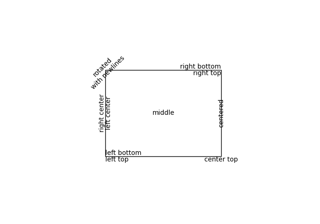
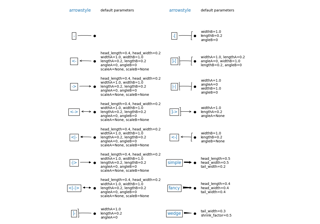
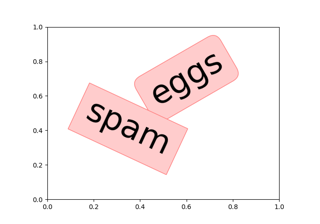
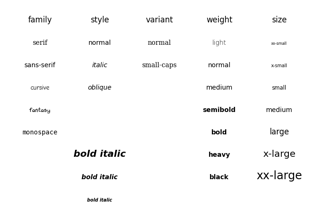
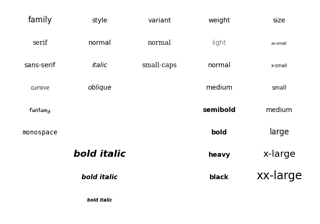
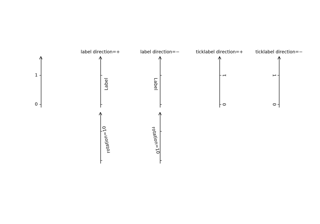
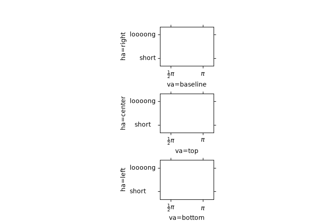
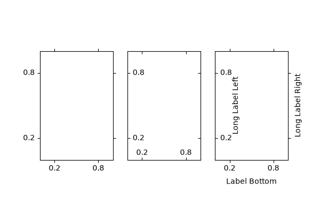
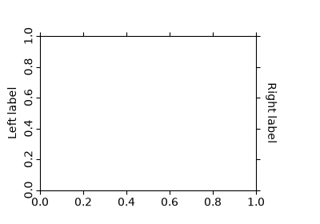
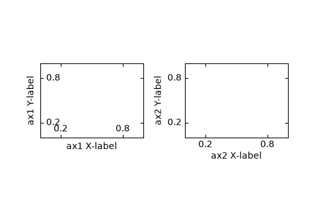
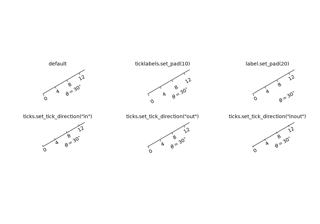
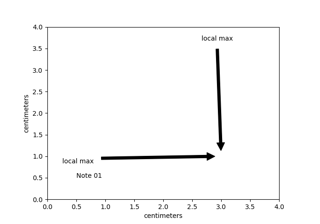
Controlling style of text and labels using a dictionary
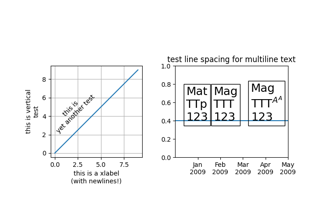
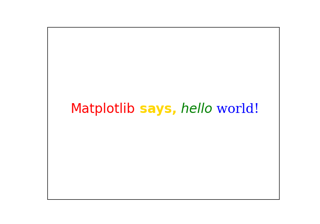
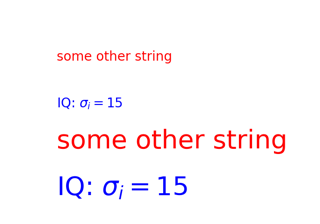
Concatenate text objects with different properties


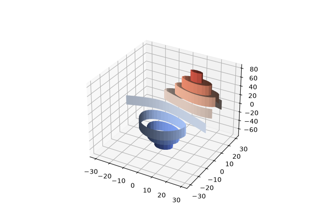
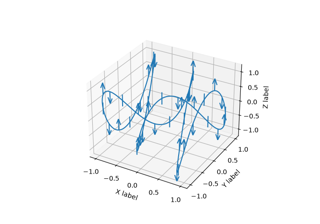
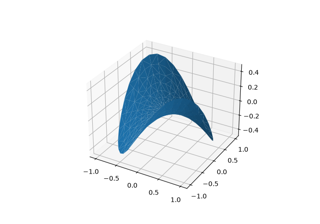
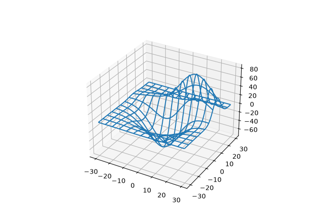
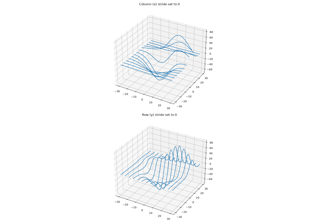
Plot contour (level) curves in 3D using the extend3d option


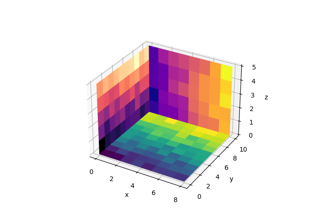


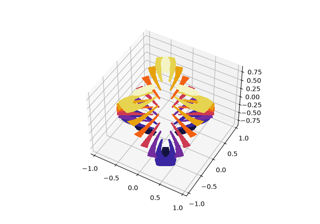

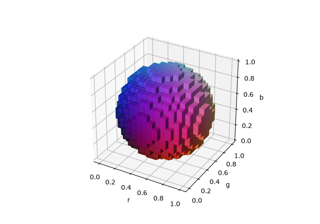
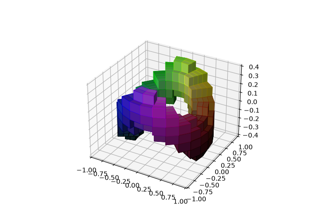
3D voxel / volumetric plot with cylindrical coordinates


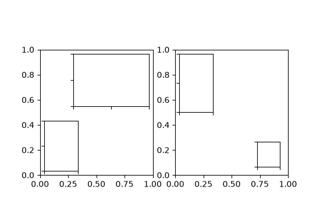
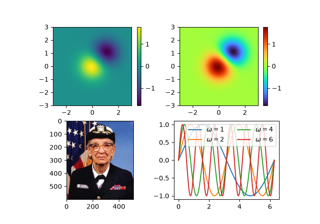
Control the position and size of a colorbar with inset_locator.inset_axes
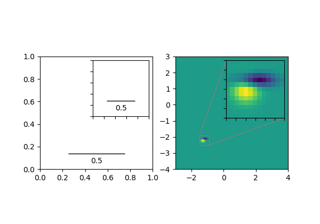
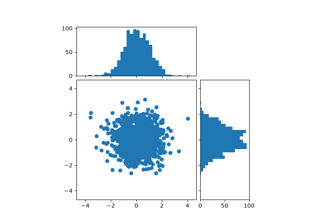
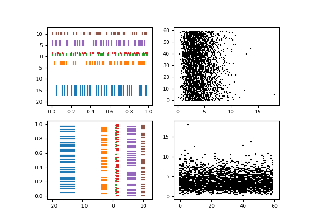
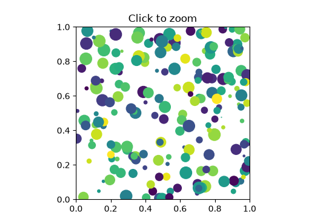
Align histogram to scatter plot using locatable Axes


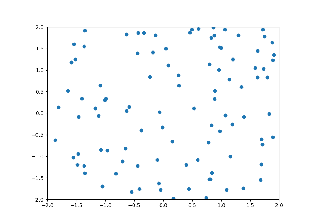


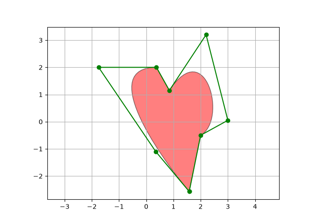
Select indices from a collection using polygon selector


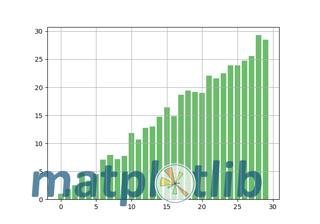
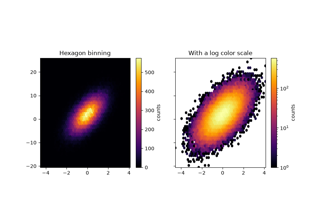
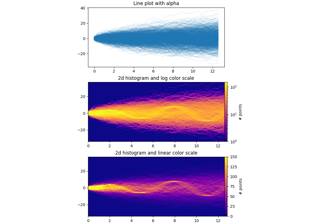
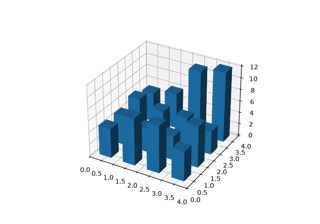
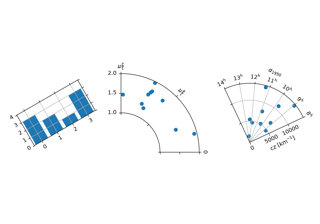
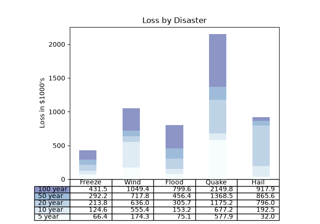
Building histograms using Rectangles and PolyCollections


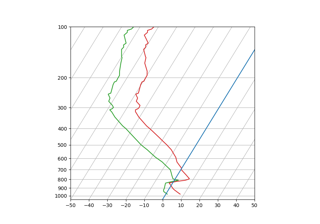
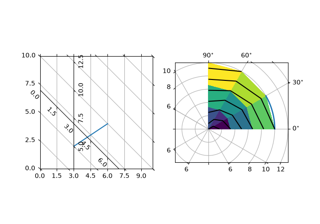
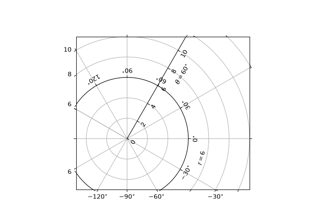
SkewT-logP diagram: using transforms and custom projections


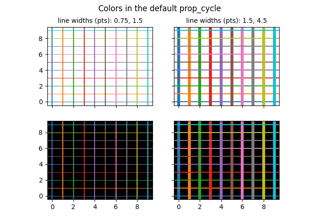
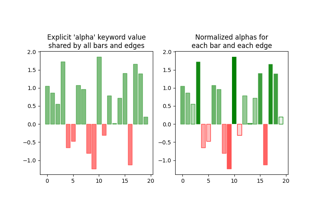
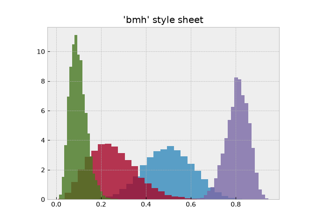
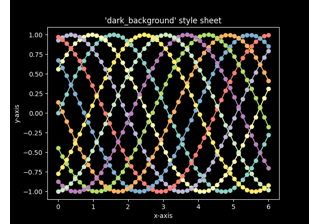
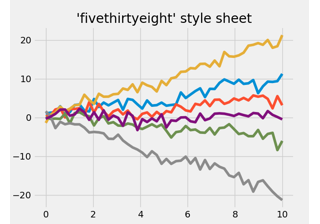
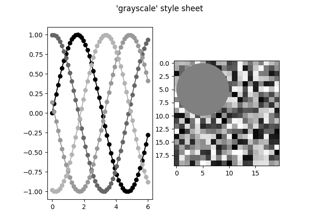
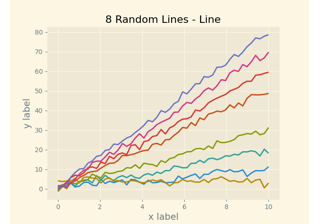
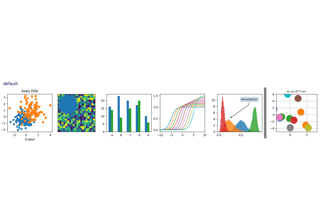
Customizing Matplotlib with style sheets and rcParams