matplotlib.axes.Axes.ecdf#
- Axes.ecdf(x, weights=None, *, complementary=False, orientation='vertical', compress=False, data=None, **kwargs)[source]#
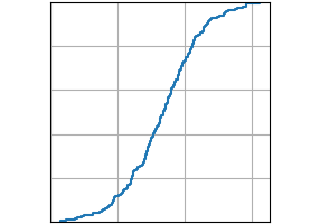
Compute and plot the empirical cumulative distribution function of x.
Added in version 3.8.
- Parameters:
- x1d array-like
The input data. Infinite entries are kept (and move the relevant end of the ecdf from 0/1), but NaNs and masked values are errors.
- weights1d array-like or None, default: None
The weights of the entries; must have the same shape as x. Weights corresponding to NaN data points are dropped, and then the remaining weights are normalized to sum to 1. If unset, all entries have the same weight.
- complementarybool, default: False
Whether to plot a cumulative distribution function, which increases from 0 to 1 (the default), or a complementary cumulative distribution function, which decreases from 1 to 0.
- orientation{"vertical", "horizontal"}, default: "vertical"
Whether the entries are plotted along the x-axis ("vertical", the default) or the y-axis ("horizontal"). This parameter takes the same values as in
hist.- compressbool, default: False
Whether multiple entries with the same values are grouped together (with a summed weight) before plotting. This is mainly useful if x contains many identical data points, to decrease the rendering complexity of the plot. If x contains no duplicate points, this has no effect and just uses some time and memory.
- Returns:
- Other Parameters:
- dataindexable object, optional
If given, the following parameters also accept a string
s, which is interpreted asdata[s]ifsis a key indata:x, weights
- **kwargs
Keyword arguments control the
Line2Dproperties:Property
Description
a filter function, which takes a (m, n, 3) float array and a dpi value, and returns a (m, n, 3) array and two offsets from the bottom left corner of the image
float or None
bool
antialiasedoraabool
BboxBaseor Nonebool
Patch or (Path, Transform) or None
CapStyleor {'butt', 'projecting', 'round'}JoinStyleor {'miter', 'round', 'bevel'}sequence of floats (on/off ink in points) or (None, None)
(2, N) array or two 1D arrays
{'default', 'steps', 'steps-pre', 'steps-mid', 'steps-post'}, default: 'default'
{'full', 'left', 'right', 'bottom', 'top', 'none'}
color or None
str
bool
object
{'-', '--', '-.', ':', '', ...} or (offset, on-off-seq)
float
marker style string,
PathorMarkerStylefloat
markersizeormsfloat
None or int or (int, int) or slice or list[int] or float or (float, float) or list[bool]
bool
list of
AbstractPathEffectfloat or callable[[Artist, Event], tuple[bool, dict]]
float
bool
(scale: float, length: float, randomness: float)
bool or None
CapStyleor {'butt', 'projecting', 'round'}JoinStyleor {'miter', 'round', 'bevel'}unknown
str
bool
1D array
1D array
float
Notes
The ecdf plot can be thought of as a cumulative histogram with one bin per data entry; i.e. it reports on the entire dataset without any arbitrary binning.
If x contains NaNs or masked entries, either remove them first from the array (if they should not taken into account), or replace them by -inf or +inf (if they should be sorted at the beginning or the end of the array).