matplotlib.axes.Axes.stem#
- Axes.stem(*args, linefmt=None, markerfmt=None, basefmt=None, bottom=0, label=None, orientation='vertical', data=None)[source]#
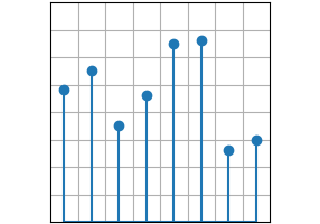
Create a stem plot.
A stem plot draws lines perpendicular to a baseline at each location locs from the baseline to heads, and places a marker there. For vertical stem plots (the default), the locs are x positions, and the heads are y values. For horizontal stem plots, the locs are y positions, and the heads are x values.
Call signature:
stem([locs,] heads, linefmt=None, markerfmt=None, basefmt=None)
The locs-positions are optional. linefmt may be provided as positional, but all other formats must be provided as keyword arguments.
- Parameters:
- locsarray-like, default: (0, 1, ..., len(heads) - 1)
For vertical stem plots, the x-positions of the stems. For horizontal stem plots, the y-positions of the stems.
- headsarray-like
For vertical stem plots, the y-values of the stem heads. For horizontal stem plots, the x-values of the stem heads.
- linefmtstr, optional
A string defining the color and/or linestyle of the vertical lines:
Character
Line Style
'-'solid line
'--'dashed line
'-.'dash-dot line
':'dotted line
Default: 'C0-', i.e. solid line with the first color of the color cycle.
Note: Markers specified through this parameter (e.g. 'x') will be silently ignored. Instead, markers should be specified using markerfmt.
- markerfmtstr, optional
A string defining the color and/or shape of the markers at the stem heads. If the marker is not given, use the marker 'o', i.e. filled circles. If the color is not given, use the color from linefmt.
- basefmtstr, default: 'C3-' ('C2-' in classic mode)
A format string defining the properties of the baseline.
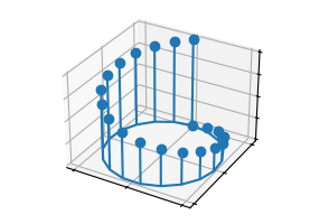
- orientation{'vertical', 'horizontal'}, default: 'vertical'
The orientation of the stems.
- bottomfloat, default: 0
The y/x-position of the baseline (depending on orientation).
- labelstr, optional
The label to use for the stems in legends.
- dataindexable object, optional
If given, all parameters also accept a string
s, which is interpreted asdata[s]ifsis a key indata.
- Returns:
StemContainerThe container may be treated like a tuple (markerline, stemlines, baseline)
Notes
See also
The MATLAB function stem which inspired this method.