matplotlib.figure#
matplotlib.figure implements the following classes:
FigureTop level
Artist, which holds all plot elements. Many methods are implemented inFigureBase.SubFigureA logical figure inside a figure, usually added to a figure (or parent
SubFigure) withFigure.add_subfigureorFigure.subfiguresmethods.
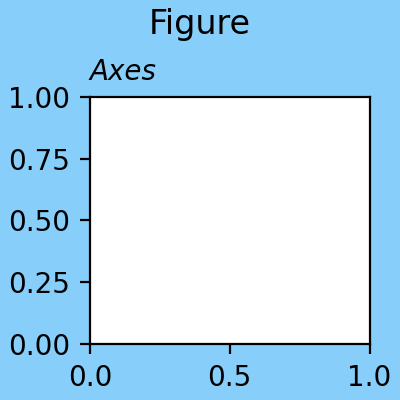
Figures are typically created using pyplot methods figure,
subplots, and subplot_mosaic.
fig, ax = plt.subplots(figsize=(2, 2), facecolor='lightskyblue',
                       layout='constrained')
fig.suptitle('Figure')
ax.set_title('Axes', loc='left', fontstyle='oblique', fontsize='medium')
(Source code, 2x.png, png)
Some situations call for directly instantiating a Figure class,
usually inside an application of some sort (see Embedding Matplotlib in graphical user interfaces for a
list of examples) . More information about Figures can be found at
Introduction to Figures.
Figure#
Figure class#
The top level container for all the plot elements. |
Adding Axes and SubFigures#
Add an |
|
Add an |
|
Add a set of subplots to this figure. |
|
Build a layout of Axes based on ASCII art or nested lists. |
|
Low-level API for creating a |
|
List of Axes in the Figure. |
|
List of Axes in the Figure. |
|
Remove the |
|
Add a set of subfigures to this figure or subfigure. |
|
Add a |
Saving#
Save the current figure as an image or vector graphic to a file. |
Annotating#
Add a colorbar to a plot. |
|
Place a legend on the figure. |
|
Add text to figure. |
|
Add a centered super title to the figure. |
|
Return the suptitle as string or an empty string if not set. |
|
Add a centered super xlabel to the figure. |
|
Return the supxlabel as string or an empty string if not set. |
|
Add a centered super ylabel to the figure. |
|
Return the supylabel as string or an empty string if not set. |
|
Align the xlabels and ylabels of subplots with the same subplots row or column (respectively) if label alignment is being done automatically (i.e. the label position is not manually set). |
|
Align the xlabels of subplots in the same subplot row if label alignment is being done automatically (i.e. the label position is not manually set). |
|
Align the ylabels of subplots in the same subplot column if label alignment is being done automatically (i.e. the label position is not manually set). |
|
Align the titles of subplots in the same subplot row if title alignment is being done automatically (i.e. the title position is not manually set). |
|
Date ticklabels often overlap, so it is useful to rotate them and right align them. |
Figure geometry#
Set the figure size in inches. |
|
Return the current size of the figure in inches. |
|
Set the height of the figure in inches. |
|
Return the figure height in inches. |
|
Set the width of the figure in inches. |
|
Return the figure width in inches. |
|
The resolution in dots per inch. |
|
Set the resolution of the figure in dots-per-inch. |
|
Return the resolution in dots per inch as a float. |
Subplot layout#
Adjust the subplot layout parameters. |
|
Set the layout engine for this figure. |
|
Discouraged or deprecated#
Adjust the padding between and around subplots. |
|
[Deprecated] Set whether and how |
|
Return whether |
|
[Deprecated] Set whether |
|
Return whether constrained layout is being used. |
|
[Deprecated] Set padding for |
|
[Deprecated] Get padding for |
Interactive#
See also
Blocking call to interact with a figure. |
|
Whenever the Axes state change, |
|
Blocking call to interact with the figure. |
|
Process a pick event. |
Modifying appearance#
Set the figure's background patch visibility, i.e. whether the figure background will be drawn. |
|
Return the figure's background patch visibility, i.e. whether the figure background will be drawn. |
|
Set the line width of the Figure rectangle. |
|
Get the line width of the Figure rectangle. |
|
Set the face color of the Figure rectangle. |
|
Get the face color of the Figure rectangle. |
|
Set the edge color of the Figure rectangle. |
|
Get the edge color of the Figure rectangle. |
Adding and getting Artists#
Add an |
|
Get a list of artists contained in the figure. |
|
Add a non-resampled image to the figure. |
Getting and modifying state#
See also
Clear the figure. |
|
Get the current Axes. |
|
Set the current Axes to be a and return a. |
|
Return a (tight) bounding box of the figure in inches. |
|
Get the artist's bounding box in display space, ignoring clipping. |
|
If using a GUI backend with pyplot, display the figure window. |
|
Set the canvas that contains the figure |
|
Draw the Artist (and its children) using the given renderer. |
|
Draw the figure with no output. |
|
Draw |
SubFigure#
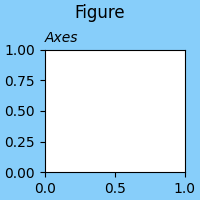
Matplotlib has the concept of a SubFigure, which is a logical figure inside
a parent Figure. It has many of the same methods as the parent. See
Nested Axes layouts.
(Source code, 2x.png, png)

SubFigure class#
Logical figure that can be placed inside a figure. |
Adding Axes and SubFigures#
Add an |
|
Add an |
|
Add a set of subplots to this figure. |
|
Build a layout of Axes based on ASCII art or nested lists. |
|
Low-level API for creating a |
|
Remove the |
|
Add a |
|
Add a set of subfigures to this figure or subfigure. |
Annotating#
Add a colorbar to a plot. |
|
Place a legend on the figure. |
|
Add text to figure. |
|
Add a centered super title to the figure. |
|
Return the suptitle as string or an empty string if not set. |
|
Add a centered super xlabel to the figure. |
|
Return the supxlabel as string or an empty string if not set. |
|
Add a centered super ylabel to the figure. |
|
Return the supylabel as string or an empty string if not set. |
|
Align the xlabels and ylabels of subplots with the same subplots row or column (respectively) if label alignment is being done automatically (i.e. the label position is not manually set). |
|
Align the xlabels of subplots in the same subplot row if label alignment is being done automatically (i.e. the label position is not manually set). |
|
Align the ylabels of subplots in the same subplot column if label alignment is being done automatically (i.e. the label position is not manually set). |
|
Align the titles of subplots in the same subplot row if title alignment is being done automatically (i.e. the title position is not manually set). |
Adding and getting Artists#
Add an |
|
Get a list of artists contained in the figure. |
Modifying appearance#
Set the figure's background patch visibility, i.e. whether the figure background will be drawn. |
|
Return the figure's background patch visibility, i.e. whether the figure background will be drawn. |
|
Set the line width of the Figure rectangle. |
|
Get the line width of the Figure rectangle. |
|
Set the face color of the Figure rectangle. |
|
Get the face color of the Figure rectangle. |
|
Set the edge color of the Figure rectangle. |
|
Get the edge color of the Figure rectangle. |
Passthroughs#
Set the resolution of parent figure in dots-per-inch. |
|
Return the resolution of the parent figure in dots-per-inch as a float. |
FigureBase parent class#
- class matplotlib.figure.FigureBase(**kwargs)[source]#
Base class for
FigureandSubFigurecontaining the methods that add artists to the figure or subfigure, create Axes, etc.- add_artist(artist, clip=False)[source]#
Add an
Artistto the figure.Usually artists are added to
Axesobjects usingAxes.add_artist; this method can be used in the rare cases where one needs to add artists directly to the figure instead.
- add_axes(*args, **kwargs)[source]#
Add an
Axesto the figure.Call signatures:
add_axes(rect, projection=None, polar=False, **kwargs)
add_axes(ax)
- Parameters:
- recttuple (left, bottom, width, height)
The dimensions (left, bottom, width, height) of the new
Axes. All quantities are in fractions of figure width and height.- projection{None, 'aitoff', 'hammer', 'lambert', 'mollweide', 'polar', 'rectilinear', str}, optional
The projection type of the
Axes. str is the name of a custom projection, seeprojections. The default None results in a 'rectilinear' projection.- polarbool, default: False
If True, equivalent to projection='polar'.
- axes_classsubclass type of
Axes, optional The
axes.Axessubclass that is instantiated. This parameter is incompatible with projection and polar. See axisartist for examples.- sharex, sharey
Axes, optional Share the x or y
axiswith sharex and/or sharey. The axis will have the same limits, ticks, and scale as the axis of the shared Axes.- labelstr
A label for the returned Axes.
- Returns:
Axes, or a subclass ofAxesThe returned Axes class depends on the projection used. It is
Axesif rectilinear projection is used andprojections.polar.PolarAxesif polar projection is used.
- Other Parameters:
- **kwargs
This method also takes the keyword arguments for the returned Axes class. The keyword arguments for the rectilinear Axes class
Axescan be found in the following table but there might also be other keyword arguments if another projection is used, see the actual Axes class.Property
Description
{'box', 'datalim'}
a filter function, which takes a (m, n, 3) float array and a dpi value, and returns a (m, n, 3) array and two offsets from the bottom left corner of the image
float or None
(float, float) or {'C', 'SW', 'S', 'SE', 'E', 'NE', ...}
bool
{'auto', 'equal'} or float
bool
unknown
unknown
Callable[[Axes, Renderer], Bbox]
bool or 'line'
float or None
BboxBaseor Nonebool
Patch or (Path, Transform) or None
bool or "auto"
bool
str
bool
object
bool
bool
unknown
list of
AbstractPathEffectNone or bool or float or callable
[left, bottom, width, height] or
Bboxfloat or None
bool
(scale: float, length: float, randomness: float)
bool or None
unknown
str
str
bool
(lower: float, upper: float)
unknown
str
(left: float, right: float)
float greater than -0.5
unknown
unknown
unknown
(lower: float, upper: float)
unknown
str
(bottom: float, top: float)
float greater than -0.5
unknown
unknown
unknown
float
Notes
In rare circumstances,
add_axesmay be called with a single argument, an Axes instance already created in the present figure but not in the figure's list of Axes.Examples
Some simple examples:
rect = l, b, w, h
fig = plt.figure()
fig.add_axes(rect)
fig.add_axes(rect, frameon=False, facecolor='g')
fig.add_axes(rect, polar=True)
ax = fig.add_axes(rect, projection='polar')
fig.delaxes(ax)
fig.add_axes(ax)
- add_gridspec(nrows=1, ncols=1, **kwargs)[source]#
Low-level API for creating a
GridSpecthat has this figure as a parent.This is a low-level API, allowing you to create a gridspec and subsequently add subplots based on the gridspec. Most users do not need that freedom and should use the higher-level methods
subplotsorsubplot_mosaic.- Parameters:
- nrowsint, default: 1
Number of rows in grid.
- ncolsint, default: 1
Number of columns in grid.
- Returns:
- Other Parameters:
- **kwargs
Keyword arguments are passed to
GridSpec.
See also
Examples
Adding a subplot that spans two rows:
fig = plt.figure()
gs = fig.add_gridspec(2, 2)
ax1 = fig.add_subplot(gs[0, 0])
ax2 = fig.add_subplot(gs[1, 0])
# spans two rows:
ax3 = fig.add_subplot(gs[:, 1])
- add_subfigure(subplotspec, **kwargs)[source]#
Add a
SubFigureto the figure as part of a subplot arrangement.- Parameters:
- subplotspec
gridspec.SubplotSpec Defines the region in a parent gridspec where the subfigure will be placed.
- subplotspec
- Returns:
- Other Parameters:
- **kwargs
Are passed to the
SubFigureobject.
See also
- add_subplot(*args, **kwargs)[source]#
Add an
Axesto the figure as part of a subplot arrangement.Call signatures:
add_subplot(nrows, ncols, index, **kwargs)
add_subplot(pos, **kwargs)
add_subplot(ax)
add_subplot()
- Parameters:
- *argsint, (int, int, index), or
SubplotSpec, default: (1, 1, 1) The position of the subplot described by one of
Three integers (nrows, ncols, index). The subplot will take the index position on a grid with nrows rows and ncols columns. index starts at 1 in the upper left corner and increases to the right. index can also be a two-tuple specifying the (first, last) indices (1-based, and including last) of the subplot, e.g.,
fig.add_subplot(3, 1, (1, 2))makes a subplot that spans the upper 2/3 of the figure.A 3-digit integer. The digits are interpreted as if given separately as three single-digit integers, i.e.
fig.add_subplot(235)is the same asfig.add_subplot(2, 3, 5). Note that this can only be used if there are no more than 9 subplots.A
SubplotSpec.
In rare circumstances,
add_subplotmay be called with a single argument, a subplot Axes instance already created in the present figure but not in the figure's list of Axes.- projection{None, 'aitoff', 'hammer', 'lambert', 'mollweide', 'polar', 'rectilinear', str}, optional
The projection type of the subplot (
Axes). str is the name of a custom projection, seeprojections. The default None results in a 'rectilinear' projection.- polarbool, default: False
If True, equivalent to projection='polar'.
- axes_classsubclass type of
Axes, optional The
axes.Axessubclass that is instantiated. This parameter is incompatible with projection and polar. See axisartist for examples.- sharex, sharey
Axes, optional Share the x or y
axiswith sharex and/or sharey. The axis will have the same limits, ticks, and scale as the axis of the shared Axes.- labelstr
A label for the returned Axes.
- *argsint, (int, int, index), or
- Returns:
AxesThe Axes of the subplot. The returned Axes can actually be an instance of a subclass, such as
projections.polar.PolarAxesfor polar projections.
- Other Parameters:
- **kwargs
This method also takes the keyword arguments for the returned Axes base class; except for the figure argument. The keyword arguments for the rectilinear base class
Axescan be found in the following table but there might also be other keyword arguments if another projection is used.Property
Description
{'box', 'datalim'}
a filter function, which takes a (m, n, 3) float array and a dpi value, and returns a (m, n, 3) array and two offsets from the bottom left corner of the image
float or None
(float, float) or {'C', 'SW', 'S', 'SE', 'E', 'NE', ...}
bool
{'auto', 'equal'} or float
bool
unknown
unknown
Callable[[Axes, Renderer], Bbox]
bool or 'line'
float or None
BboxBaseor Nonebool
Patch or (Path, Transform) or None
bool or "auto"
bool
str
bool
object
bool
bool
unknown
list of
AbstractPathEffectNone or bool or float or callable
[left, bottom, width, height] or
Bboxfloat or None
bool
(scale: float, length: float, randomness: float)
bool or None
unknown
str
str
bool
(lower: float, upper: float)
unknown
str
(left: float, right: float)
float greater than -0.5
unknown
unknown
unknown
(lower: float, upper: float)
unknown
str
(bottom: float, top: float)
float greater than -0.5
unknown
unknown
unknown
float
Examples
fig = plt.figure()

fig.add_subplot(231)
ax1 = fig.add_subplot(2, 3, 1)  # equivalent but more general

fig.add_subplot(232, frameon=False)  # subplot with no frame
fig.add_subplot(233, projection='polar')  # polar subplot
fig.add_subplot(234, sharex=ax1)  # subplot sharing x-axis with ax1
fig.add_subplot(235, facecolor="red")  # red subplot

ax1.remove()  # delete ax1 from the figure
fig.add_subplot(ax1)  # add ax1 back to the figure
- align_labels(axs=None)[source]#
Align the xlabels and ylabels of subplots with the same subplots row or column (respectively) if label alignment is being done automatically (i.e. the label position is not manually set).
Alignment persists for draw events after this is called.
- Parameters:
See also
Notes
This assumes that all Axes in
axsare from the sameGridSpec, so that theirSubplotSpecpositions correspond to figure positions.
- align_titles(axs=None)[source]#
Align the titles of subplots in the same subplot row if title alignment is being done automatically (i.e. the title position is not manually set).
Alignment persists for draw events after this is called.
- Parameters:
See also
Notes
This assumes that all Axes in
axsare from the sameGridSpec, so that theirSubplotSpecpositions correspond to figure positions.Examples
Example with titles:
fig, axs = plt.subplots(1, 2)
axs[0].set_aspect('equal')
axs[0].set_title('Title 0')
axs[1].set_title('Title 1')
fig.align_titles()
- align_xlabels(axs=None)[source]#
Align the xlabels of subplots in the same subplot row if label alignment is being done automatically (i.e. the label position is not manually set).
Alignment persists for draw events after this is called.
If a label is on the bottom, it is aligned with labels on Axes that also have their label on the bottom and that have the same bottom-most subplot row. If the label is on the top, it is aligned with labels on Axes with the same top-most row.
- Parameters:
See also
Notes
This assumes that all Axes in
axsare from the sameGridSpec, so that theirSubplotSpecpositions correspond to figure positions.Examples
Example with rotated xtick labels:
fig, axs = plt.subplots(1, 2)
axs[0].tick_params(axis='x', rotation=55)
axs[0].set_xlabel('XLabel 0')
axs[1].set_xlabel('XLabel 1')
fig.align_xlabels()
- align_ylabels(axs=None)[source]#
Align the ylabels of subplots in the same subplot column if label alignment is being done automatically (i.e. the label position is not manually set).
Alignment persists for draw events after this is called.
If a label is on the left, it is aligned with labels on Axes that also have their label on the left and that have the same left-most subplot column. If the label is on the right, it is aligned with labels on Axes with the same right-most column.
- Parameters:
See also
Notes
This assumes that all Axes in
axsare from the sameGridSpec, so that theirSubplotSpecpositions correspond to figure positions.Examples
Example with large yticks labels:
fig, axs = plt.subplots(2, 1)
axs[0].plot(np.arange(0, 1000, 50))
axs[0].set_ylabel('YLabel 0')
axs[1].set_ylabel('YLabel 1')
fig.align_ylabels()
- autofmt_xdate(bottom=0.2, rotation=30, ha='right', which='major')[source]#
Date ticklabels often overlap, so it is useful to rotate them and right align them. Also, a common use case is a number of subplots with shared x-axis where the x-axis is date data. The ticklabels are often long, and it helps to rotate them on the bottom subplot and turn them off on other subplots, as well as turn off xlabels.
- Parameters:
- bottomfloat, default: 0.2
The bottom of the subplots for
subplots_adjust.- rotationfloat, default: 30 degrees
The rotation angle of the xtick labels in degrees.
- ha{'left', 'center', 'right'}, default: 'right'
The horizontal alignment of the xticklabels.
- which{'major', 'minor', 'both'}, default: 'major'
Selects which ticklabels to rotate.
- clear(keep_observers=False)[source]#
Clear the figure.
- Parameters:
- keep_observersbool, default: False
Set keep_observers to True if, for example, a gui widget is tracking the Axes in the figure.
- clf(keep_observers=False)[source]#
[Discouraged] Alias for the
clear()method.Discouraged
The use of
clf()is discouraged. Useclear()instead.- Parameters:
- keep_observersbool, default: False
Set keep_observers to True if, for example, a gui widget is tracking the Axes in the figure.
- colorbar(mappable, cax=None, ax=None, use_gridspec=True, **kwargs)[source]#
Add a colorbar to a plot.
- Parameters:
- mappable
The
matplotlib.colorizer.ColorizingArtist(i.e.,AxesImage,ContourSet, etc.) described by this colorbar. This argument is mandatory for theFigure.colorbarmethod but optional for thepyplot.colorbarfunction, which sets the default to the current image.Note that one can create a
colorizer.ColorizingArtist"on-the-fly" to generate colorbars not attached to a previously drawn artist, e.g.cr = colorizer.Colorizer(norm=norm, cmap=cmap) fig.colorbar(colorizer.ColorizingArtist(cr), ax=ax)
- cax
Axes, optional Axes into which the colorbar will be drawn. If
None, then a new Axes is created and the space for it will be stolen from the Axes(s) specified in ax.- ax
Axesor iterable ornumpy.ndarrayof Axes, optional The one or more parent Axes from which space for a new colorbar Axes will be stolen. This parameter is only used if cax is not set.
Defaults to the Axes that contains the mappable used to create the colorbar.
- use_gridspecbool, optional
If cax is
None, a new cax is created as an instance of Axes. If ax is positioned with a subplotspec and use_gridspec isTrue, then cax is also positioned with a subplotspec.
- Returns:
- colorbar
Colorbar
- colorbar
- Other Parameters:
- locationNone or {'left', 'right', 'top', 'bottom'}
The location, relative to the parent Axes, where the colorbar Axes is created. It also determines the orientation of the colorbar (colorbars on the left and right are vertical, colorbars at the top and bottom are horizontal). If None, the location will come from the orientation if it is set (vertical colorbars on the right, horizontal ones at the bottom), or default to 'right' if orientation is unset.
- orientationNone or {'vertical', 'horizontal'}
The orientation of the colorbar. It is preferable to set the location of the colorbar, as that also determines the orientation; passing incompatible values for location and orientation raises an exception.
- fractionfloat, default: 0.15
Fraction of original Axes to use for colorbar.
- shrinkfloat, default: 1.0
Fraction by which to multiply the size of the colorbar.
- aspectfloat, default: 20
Ratio of long to short dimensions.
- padfloat, default: 0.05 if vertical, 0.15 if horizontal
Fraction of original Axes between colorbar and new image Axes.
- anchor(float, float), optional
The anchor point of the colorbar Axes. Defaults to (0.0, 0.5) if vertical; (0.5, 1.0) if horizontal.
- panchor(float, float), or False, optional
The anchor point of the colorbar parent Axes. If False, the parent axes' anchor will be unchanged. Defaults to (1.0, 0.5) if vertical; (0.5, 0.0) if horizontal.
- extend{'neither', 'both', 'min', 'max'}
Make pointed end(s) for out-of-range values (unless 'neither'). These are set for a given colormap using the colormap set_under and set_over methods.
- extendfrac{None, 'auto', length, lengths}
If set to None, both the minimum and maximum triangular colorbar extensions will have a length of 5% of the interior colorbar length (this is the default setting).
If set to 'auto', makes the triangular colorbar extensions the same lengths as the interior boxes (when spacing is set to 'uniform') or the same lengths as the respective adjacent interior boxes (when spacing is set to 'proportional').
If a scalar, indicates the length of both the minimum and maximum triangular colorbar extensions as a fraction of the interior colorbar length. A two-element sequence of fractions may also be given, indicating the lengths of the minimum and maximum colorbar extensions respectively as a fraction of the interior colorbar length.
- extendrectbool
If False the minimum and maximum colorbar extensions will be triangular (the default). If True the extensions will be rectangular.
- ticksNone or list of ticks or Locator
If None, ticks are determined automatically from the input.
- formatNone or str or Formatter
If None,
ScalarFormatteris used. Format strings, e.g.,"%4.2e"or"{x:.2e}", are supported. An alternativeFormattermay be given instead.- drawedgesbool
Whether to draw lines at color boundaries.
- labelstr
The label on the colorbar's long axis.
- boundaries, valuesNone or a sequence
If unset, the colormap will be displayed on a 0-1 scale. If sequences, values must have a length 1 less than boundaries. For each region delimited by adjacent entries in boundaries, the color mapped to the corresponding value in values will be used. The size of each region is determined by the spacing parameter. Normally only useful for indexed colors (i.e.
norm=NoNorm()) or other unusual circumstances.- spacing{'uniform', 'proportional'}
For discrete colorbars (
BoundaryNormor contours), 'uniform' gives each color the same space; 'proportional' makes the space proportional to the data interval.
Notes
If mappable is a
ContourSet, its extend kwarg is included automatically.The shrink kwarg provides a simple way to scale the colorbar with respect to the Axes. Note that if cax is specified, it determines the size of the colorbar, and shrink and aspect are ignored.
For more precise control, you can manually specify the positions of the axes objects in which the mappable and the colorbar are drawn. In this case, do not use any of the Axes properties kwargs.
It is known that some vector graphics viewers (svg and pdf) render white gaps between segments of the colorbar. This is due to bugs in the viewers, not Matplotlib. As a workaround, the colorbar can be rendered with overlapping segments:
cbar = colorbar()
cbar.solids.set_edgecolor("face")
draw()
However, this has negative consequences in other circumstances, e.g. with semi-transparent images (alpha < 1) and colorbar extensions; therefore, this workaround is not used by default (see issue #1188).
- contains(mouseevent)[source]#
Test whether the mouse event occurred on the figure.
- Returns:
- bool, {}
- draw(renderer)[source]#
Draw the Artist (and its children) using the given renderer.
This has no effect if the artist is not visible (
Artist.get_visiblereturns False).- Parameters:
- renderer
RendererBasesubclass.
- renderer
Notes
This method is overridden in the Artist subclasses.
- property figure#
The root
Figure. To get the parent of aSubFigure, use theget_figuremethod.
- property frameon#
Return the figure's background patch visibility, i.e. whether the figure background will be drawn. Equivalent to
Figure.patch.get_visible().
- gca()[source]#
Get the current Axes.
If there is currently no Axes on this Figure, a new one is created using
Figure.add_subplot. (To test whether there is currently an Axes on a Figure, check whetherfigure.axesis empty. To test whether there is currently a Figure on the pyplot figure stack, check whetherpyplot.get_fignums()is empty.)
- get_default_bbox_extra_artists()[source]#
Return a list of Artists typically used in
Figure.get_tightbbox.
- get_figure(root=None)[source]#
Return the
FigureorSubFigureinstance the (Sub)Figure belongs to.- Parameters:
- rootbool, default=True
If False, return the (Sub)Figure this artist is on. If True, return the root Figure for a nested tree of SubFigures.
Deprecated since version 3.10: From version 3.12 root will default to False.
- get_frameon()[source]#
Return the figure's background patch visibility, i.e. whether the figure background will be drawn. Equivalent to
Figure.patch.get_visible().
- get_tightbbox(renderer=None, *, bbox_extra_artists=None)[source]#
Return a (tight) bounding box of the figure in inches.
Note that
FigureBasediffers from all other artists, which return theirBboxin pixels.Artists that have
artist.set_in_layout(False)are not included in the bbox.- Parameters:
- renderer
RendererBasesubclass Renderer that will be used to draw the figures (i.e.
fig.canvas.get_renderer())- bbox_extra_artistslist of
ArtistorNone List of artists to include in the tight bounding box. If
None(default), then all artist children of each Axes are included in the tight bounding box.
- renderer
- Returns:
BboxBasecontaining the bounding box (in figure inches).
- get_window_extent(renderer=None)[source]#
Get the artist's bounding box in display space, ignoring clipping.
The bounding box's width and height are non-negative.
Subclasses should override for inclusion in the bounding box "tight" calculation. Default is to return an empty bounding box at 0, 0.
Warning
The extent can change due to any changes in the transform stack, such as changing the Axes limits, the figure size, the canvas used (as is done when saving a figure), or the DPI.
Relying on a once-retrieved window extent can lead to unexpected behavior in various cases such as interactive figures being resized or moved to a screen with different dpi, or figures that look fine on screen render incorrectly when saved to file.
To get accurate results you may need to manually call
savefigordraw_without_renderingto have Matplotlib compute the rendered size.- Parameters:
- renderer
RendererBase, optional Renderer used to draw the figure (i.e.
fig.canvas.get_renderer()).
- renderer
See also
Artist.get_tightbboxGet the artist bounding box, taking clipping into account.
- legend(*args, **kwargs)[source]#
Place a legend on the figure.
Call signatures:
legend()
legend(handles, labels)
legend(handles=handles)
legend(labels)
The call signatures correspond to the following different ways to use this method:
1. Automatic detection of elements to be shown in the legend
The elements to be added to the legend are automatically determined, when you do not pass in any extra arguments.
In this case, the labels are taken from the artist. You can specify them either at artist creation or by calling the
set_label()method on the artist:ax.plot([1, 2, 3], label='Inline label') fig.legend()
or:
line, = ax.plot([1, 2, 3])
line.set_label('Label via method')
fig.legend()
Specific lines can be excluded from the automatic legend element selection by defining a label starting with an underscore. This is default for all artists, so calling
Figure.legendwithout any arguments and without setting the labels manually will result in no legend being drawn.2. Explicitly listing the artists and labels in the legend
For full control of which artists have a legend entry, it is possible to pass an iterable of legend artists followed by an iterable of legend labels respectively:
fig.legend([line1, line2, line3], ['label1', 'label2', 'label3'])
3. Explicitly listing the artists in the legend
This is similar to 2, but the labels are taken from the artists' label properties. Example:
line1, = ax1.plot([1, 2, 3], label='label1')
line2, = ax2.plot([1, 2, 3], label='label2')
fig.legend(handles=[line1, line2])
4. Labeling existing plot elements
Discouraged
This call signature is discouraged, because the relation between plot elements and labels is only implicit by their order and can easily be mixed up.
To make a legend for all artists on all Axes, call this function with an iterable of strings, one for each legend item. For example:
fig, (ax1, ax2) = plt.subplots(1, 2)
ax1.plot([1, 3, 5], color='blue')
ax2.plot([2, 4, 6], color='red')
fig.legend(['the blues', 'the reds'])
- Parameters:
- handleslist of
Artist, optional A list of Artists (lines, patches) to be added to the legend. Use this together with labels, if you need full control on what is shown in the legend and the automatic mechanism described above is not sufficient.
The length of handles and labels should be the same in this case. If they are not, they are truncated to the smaller length.
- labelslist of str, optional
A list of labels to show next to the artists. Use this together with handles, if you need full control on what is shown in the legend and the automatic mechanism described above is not sufficient.
- handleslist of
- Returns:
- Other Parameters:
- locstr or pair of floats, default: 'upper right'
The location of the legend.
The string locations place the legend at the corresponding position within the bounding box, which by default is the full figure area. The bounding box can be changed via bbox_to_anchor.
The positions are visualized below:
+--------------+--------------+---------------+
| 'upper left' |'upper center'| 'upper right' |
+--------------+--------------+---------------+
|'center left' |   'center'   |'center right' |
+--------------+--------------+---------------+
| 'lower left' |'lower center'| 'lower right' |
+--------------+--------------+---------------+
The location can also be a 2-tuple giving the coordinates of the lower-left corner of the legend in figure coordinates (in which case bbox_to_anchor will be ignored).
For back-compatibility,
'center right'(but no other location) can also be spelled'right', and each "string" location can also be given as a numeric value:Location String
Location Code
'best' (Axes only)
0
'upper right'
1
'upper left'
2
'lower left'
3
'lower right'
4
'right'
5
'center left'
6
'center right'
7
'lower center'
8
'upper center'
9
'center'
10
If a figure is using the constrained layout manager, the string codes of the loc keyword argument can get better layout behaviour using the prefix 'outside'. There is ambiguity at the corners, so 'outside upper right' will make space for the legend above the rest of the axes in the layout, and 'outside right upper' will make space on the right side of the layout. In addition to the values of loc listed above, we have 'outside right upper', 'outside right lower', 'outside left upper', and 'outside left lower'. See Legend guide for more details.
- bbox_to_anchor
BboxBase, 2-tuple, or 4-tuple of floats Box that is used to position the legend in conjunction with loc. This is an advanced option for free placement of the legend. For most use cases, loc alone is sufficient.
Defaults to
axes.bbox(if called as a method toAxes.legend) orfigure.bbox(iffigure.legend).Bbox coordinates are interpreted in the coordinate system given by bbox_transform, with the default transform Axes or Figure coordinates, depending on which
legendis called.If a 4-tuple or
BboxBaseis given, then it specifies the bbox(x, y, width, height)that the legend is placed in. To put the legend in the best location in the bottom right quadrant of the Axes (or figure):loc='best', bbox_to_anchor=(0.5, 0., 0.5, 0.5)
A 2-tuple
(x, y)places the corner of the legend specified by loc at x, y. For example, to put the legend's upper right-hand corner in the center of the Axes (or figure) the following keywords can be used:loc='upper right', bbox_to_anchor=(0.5, 0.5)
For more details on legend positioning, see the Legend guide.
- ncolsint, default: 1
The number of columns that the legend has.
For backward compatibility, the spelling ncol is also supported but it is discouraged. If both are given, ncols takes precedence.
- propNone or
FontPropertiesor dict The font properties of the legend. If None (default), the current
matplotlib.rcParamswill be used.- fontsizeint or {'xx-small', 'x-small', 'small', 'medium', 'large', 'x-large', 'xx-large'}
The font size of the legend. If the value is numeric the size will be the absolute font size in points. String values are relative to the current default font size. This argument is only used if prop is not specified.
- labelcolorstr or list, default:
rcParams["legend.labelcolor"](default:'None') The color of the text in the legend. Either a valid color string (for example, 'red'), or a list of color strings. The labelcolor can also be made to match the color of the line or marker using 'linecolor', 'markerfacecolor' (or 'mfc'), or 'markeredgecolor' (or 'mec').
Labelcolor can be set globally using
rcParams["legend.labelcolor"](default:'None'). If None, usercParams["text.color"](default:'black').- numpointsint, default:
rcParams["legend.numpoints"](default:1) The number of marker points in the legend when creating a legend entry for a
Line2D(line).- scatterpointsint, default:
rcParams["legend.scatterpoints"](default:1) The number of marker points in the legend when creating a legend entry for a
PathCollection(scatter plot).- scatteryoffsetsiterable of floats, default:
[0.375, 0.5, 0.3125] The vertical offset (relative to the font size) for the markers created for a scatter plot legend entry. 0.0 is at the base the legend text, and 1.0 is at the top. To draw all markers at the same height, set to
[0.5].- markerscalefloat, default:
rcParams["legend.markerscale"](default:1.0) The relative size of legend markers compared to the originally drawn ones.
- markerfirstbool, default: True
If True, legend marker is placed to the left of the legend label. If False, legend marker is placed to the right of the legend label.
- reversebool, default: False
If True, the legend labels are displayed in reverse order from the input. If False, the legend labels are displayed in the same order as the input.
Added in version 3.7.
- frameonbool, default:
rcParams["legend.frameon"](default:True) Whether the legend should be drawn on a patch (frame).
- fancyboxbool, default:
rcParams["legend.fancybox"](default:True) Whether round edges should be enabled around the
FancyBboxPatchwhich makes up the legend's background.- shadowNone, bool or dict, default:
rcParams["legend.shadow"](default:False) Whether to draw a shadow behind the legend. The shadow can be configured using
Patchkeywords. Customization viarcParams["legend.shadow"](default:False) is currently not supported.- framealphafloat, default:
rcParams["legend.framealpha"](default:0.8) The alpha transparency of the legend's background. If shadow is activated and framealpha is
None, the default value is ignored.- facecolor"inherit" or color, default:
rcParams["legend.facecolor"](default:'inherit') The legend's background color. If
"inherit", usercParams["axes.facecolor"](default:'white').- edgecolor"inherit" or color, default:
rcParams["legend.edgecolor"](default:'0.8') The legend's background patch edge color. If
"inherit", usercParams["axes.edgecolor"](default:'black').- linewidthfloat or None, default:
rcParams["legend.linewidth"](default:None) The legend's background patch edge linewidth. If
None, usercParams["patch.linewidth"](default:1.0).Added in version 3.11.
- mode{"expand", None}
If mode is set to
"expand"the legend will be horizontally expanded to fill the Axes area (or bbox_to_anchor if defines the legend's size).- bbox_transformNone or
Transform The transform for the bounding box (bbox_to_anchor). For a value of
None(default) the Axes'matplotlib.axes.Axes.transAxestransform will be used.- titlestr or None
The legend's title. Default is no title (
None).- title_fontpropertiesNone or
FontPropertiesor dict The font properties of the legend's title. If None (default), the title_fontsize argument will be used if present; if title_fontsize is also None, the current
rcParams["legend.title_fontsize"](default:None) will be used.- title_fontsizeint or {'xx-small', 'x-small', 'small', 'medium', 'large', 'x-large', 'xx-large'}, default:
rcParams["legend.title_fontsize"](default:None) The font size of the legend's title. Note: This cannot be combined with title_fontproperties. If you want to set the fontsize alongside other font properties, use the size parameter in title_fontproperties.
- alignment{'center', 'left', 'right'}, default: 'center'
The alignment of the legend title and the box of entries. The entries are aligned as a single block, so that markers always lined up.
- borderpadfloat, default:
rcParams["legend.borderpad"](default:0.4) The fractional whitespace inside the legend border, in font-size units.
- labelspacingfloat, default:
rcParams["legend.labelspacing"](default:0.5) The vertical space between the legend entries, in font-size units.
- handlelengthfloat, default:
rcParams["legend.handlelength"](default:2.0) The length of the legend handles, in font-size units.
- handleheightfloat, default:
rcParams["legend.handleheight"](default:0.7) The height of the legend handles, in font-size units.
- handletextpadfloat, default:
rcParams["legend.handletextpad"](default:0.8) The pad between the legend handle and text, in font-size units.
- borderaxespadfloat, default:
rcParams["legend.borderaxespad"](default:0.5) The pad between the Axes and legend border, in font-size units.
- columnspacingfloat, default:
rcParams["legend.columnspacing"](default:2.0) The spacing between columns, in font-size units.
- handler_mapdict or None
The custom dictionary mapping instances or types to a legend handler. This handler_map updates the default handler map found at
matplotlib.legend.Legend.get_legend_handler_map.- draggablebool, default: False
Whether the legend can be dragged with the mouse.
See also
Notes
Some artists are not supported by this function. See Legend guide for details.
- set(*, agg_filter=<UNSET>, alpha=<UNSET>, animated=<UNSET>, clip_box=<UNSET>, clip_on=<UNSET>, clip_path=<UNSET>, edgecolor=<UNSET>, facecolor=<UNSET>, frameon=<UNSET>, gid=<UNSET>, in_layout=<UNSET>, label=<UNSET>, linewidth=<UNSET>, mouseover=<UNSET>, path_effects=<UNSET>, picker=<UNSET>, rasterized=<UNSET>, sketch_params=<UNSET>, snap=<UNSET>, transform=<UNSET>, url=<UNSET>, visible=<UNSET>, zorder=<UNSET>)[source]#
Set multiple properties at once.
a.set(a=A, b=B, c=C)
is equivalent to
a.set_a(A)
a.set_b(B)
a.set_c(C)
In addition to the full property names, aliases are also supported, e.g.
set(lw=2)is equivalent toset(linewidth=2), but it is an error to pass both simultaneously.The order of the individual setter calls matches the order of parameters in
set(). However, most properties do not depend on each other so that order is rarely relevant.Supported properties are
Property
Description
a filter function, which takes a (m, n, 3) float array and a dpi value, and returns a (m, n, 3) array and two offsets from the bottom left corner of the image
float or None
bool
BboxBaseor Nonebool
Patch or (Path, Transform) or None
unknown
bool
str
bool
object
number
bool
list of
AbstractPathEffectNone or bool or float or callable
bool
(scale: float, length: float, randomness: float)
bool or None
str
bool
float
- set_figure(fig)[source]#
Deprecated since version 3.10: Currently this method will raise an exception if fig is anything other than the root
Figurethis (Sub)Figure is on. In future it will always raise an exception.
- set_frameon(b)[source]#
Set the figure's background patch visibility, i.e. whether the figure background will be drawn. Equivalent to
Figure.patch.set_visible().- Parameters:
- bbool
- set_linewidth(linewidth)[source]#
Set the line width of the Figure rectangle.
- Parameters:
- linewidthnumber
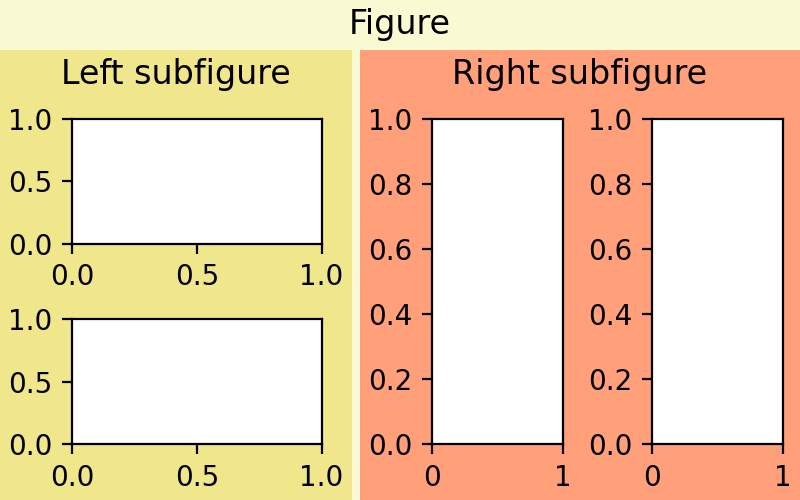
- subfigures(nrows=1, ncols=1, squeeze=True, wspace=None, hspace=None, width_ratios=None, height_ratios=None, **kwargs)[source]#
Add a set of subfigures to this figure or subfigure.
A subfigure has the same artist methods as a figure, and is logically the same as a figure, but cannot print itself. See Figure subfigures.
Changed in version 3.10: subfigures are now added in row-major order.
- Parameters:
- nrows, ncolsint, default: 1
Number of rows/columns of the subfigure grid.
- squeezebool, default: True
If True, extra dimensions are squeezed out from the returned array of subfigures.
- wspace, hspacefloat, default: None
The amount of width/height reserved for space between subfigures, expressed as a fraction of the average subfigure width/height. If not given, the values will be inferred from rcParams if using constrained layout (see
ConstrainedLayoutEngine), or zero if not using a layout engine.- width_ratiosarray-like of length ncols, optional
Defines the relative widths of the columns. Each column gets a relative width of
width_ratios[i] / sum(width_ratios). If not given, all columns will have the same width.- height_ratiosarray-like of length nrows, optional
Defines the relative heights of the rows. Each row gets a relative height of
height_ratios[i] / sum(height_ratios). If not given, all rows will have the same height.
- subplot_mosaic(mosaic, *, sharex=False, sharey=False, width_ratios=None, height_ratios=None, empty_sentinel='.', subplot_kw=None, per_subplot_kw=None, gridspec_kw=None)[source]#
Build a layout of Axes based on ASCII art or nested lists.
This is a helper function to build complex GridSpec layouts visually.
See Complex and semantic figure composition (subplot_mosaic) for an example and full API documentation
- Parameters:
- mosaiclist of list of {hashable or nested} or str
A visual layout of how you want your Axes to be arranged labeled as strings. For example
x = [['A panel', 'A panel', 'edge'],
     ['C panel', '.',       'edge']]
produces 4 Axes:
'A panel' which is 1 row high and spans the first two columns
'edge' which is 2 rows high and is on the right edge
'C panel' which in 1 row and 1 column wide in the bottom left
a blank space 1 row and 1 column wide in the bottom center
Any of the entries in the layout can be a list of lists of the same form to create nested layouts.
If input is a str, then it can either be a multi-line string of the form
'''
AAE
C.E
'''
where each character is a column and each line is a row. Or it can be a single-line string where rows are separated by
;:'AB;CC'The string notation allows only single character Axes labels and does not support nesting but is very terse.
The Axes identifiers may be
stror a non-iterable hashable object (e.g.tuples may not be used).- sharex, shareybool, default: False
If True, the x-axis (sharex) or y-axis (sharey) will be shared among all subplots. In that case, tick label visibility and axis units behave as for
subplots. If False, each subplot's x- or y-axis will be independent.- width_ratiosarray-like of length ncols, optional
Defines the relative widths of the columns. Each column gets a relative width of
width_ratios[i] / sum(width_ratios). If not given, all columns will have the same width. Equivalent togridspec_kw={'width_ratios': [...]}. In the case of nested layouts, this argument applies only to the outer layout.- height_ratiosarray-like of length nrows, optional
Defines the relative heights of the rows. Each row gets a relative height of
height_ratios[i] / sum(height_ratios). If not given, all rows will have the same height. Equivalent togridspec_kw={'height_ratios': [...]}. In the case of nested layouts, this argument applies only to the outer layout.- subplot_kwdict, optional
Dictionary with keywords passed to the
Figure.add_subplotcall used to create each subplot. These values may be overridden by values in per_subplot_kw.- per_subplot_kwdict, optional
A dictionary mapping the Axes identifiers or tuples of identifiers to a dictionary of keyword arguments to be passed to the
Figure.add_subplotcall used to create each subplot. The values in these dictionaries have precedence over the values in subplot_kw.If mosaic is a string, and thus all keys are single characters, it is possible to use a single string instead of a tuple as keys; i.e.
"AB"is equivalent to("A", "B").Added in version 3.7.
- gridspec_kwdict, optional
Dictionary with keywords passed to the
GridSpecconstructor used to create the grid the subplots are placed on. In the case of nested layouts, this argument applies only to the outer layout. For more complex layouts, users should useFigure.subfiguresto create the nesting.- empty_sentinelobject, optional
Entry in the layout to mean "leave this space empty". Defaults to
'.'. Note, if layout is a string, it is processed viainspect.cleandocto remove leading white space, which may interfere with using white-space as the empty sentinel.
- Returns:
- dict[label, Axes]
A dictionary mapping the labels to the Axes objects. The order of the Axes is left-to-right and top-to-bottom of their position in the total layout.
- subplots(nrows=1, ncols=1, *, sharex=False, sharey=False, squeeze=True, width_ratios=None, height_ratios=None, subplot_kw=None, gridspec_kw=None)[source]#
Add a set of subplots to this figure.
This utility wrapper makes it convenient to create common layouts of subplots in a single call.
- Parameters:
- nrows, ncolsint, default: 1
Number of rows/columns of the subplot grid.
- sharex, shareybool or {'none', 'all', 'row', 'col'}, default: False
Controls sharing of x-axis (sharex) or y-axis (sharey):
True or 'all': x- or y-axis will be shared among all subplots.
False or 'none': each subplot x- or y-axis will be independent.
'row': each subplot row will share an x- or y-axis.
'col': each subplot column will share an x- or y-axis.
When subplots have a shared x-axis along a column, only the x tick labels of the bottom subplot are created. Similarly, when subplots have a shared y-axis along a row, only the y tick labels of the first column subplot are created. To later turn other subplots' ticklabels on, use
tick_params.When subplots have a shared axis that has units, calling
Axis.set_unitswill update each axis with the new units.Note that it is not possible to unshare axes.
- squeezebool, default: True
If True, extra dimensions are squeezed out from the returned array of Axes:
if only one subplot is constructed (nrows=ncols=1), the resulting single Axes object is returned as a scalar.
for Nx1 or 1xM subplots, the returned object is a 1D numpy object array of Axes objects.
for NxM, subplots with N>1 and M>1 are returned as a 2D array.
If False, no squeezing at all is done: the returned Axes object is always a 2D array containing Axes instances, even if it ends up being 1x1.
- width_ratiosarray-like of length ncols, optional
Defines the relative widths of the columns. Each column gets a relative width of
width_ratios[i] / sum(width_ratios). If not given, all columns will have the same width. Equivalent togridspec_kw={'width_ratios': [...]}.- height_ratiosarray-like of length nrows, optional
Defines the relative heights of the rows. Each row gets a relative height of
height_ratios[i] / sum(height_ratios). If not given, all rows will have the same height. Equivalent togridspec_kw={'height_ratios': [...]}.- subplot_kwdict, optional
Dict with keywords passed to the
Figure.add_subplotcall used to create each subplot.- gridspec_kwdict, optional
Dict with keywords passed to the
GridSpecconstructor used to create the grid the subplots are placed on.
- Returns:
Examples
# First create some toy data:
x = np.linspace(0, 2*np.pi, 400)
y = np.sin(x**2)

# Create a figure
fig = plt.figure()

# Create a subplot
ax = fig.subplots()
ax.plot(x, y)
ax.set_title('Simple plot')

# Create two subplots and unpack the output array immediately
ax1, ax2 = fig.subplots(1, 2, sharey=True)
ax1.plot(x, y)
ax1.set_title('Sharing Y axis')
ax2.scatter(x, y)

# Create four polar Axes and access them through the returned array
axes = fig.subplots(2, 2, subplot_kw=dict(projection='polar'))
axes[0, 0].plot(x, y)
axes[1, 1].scatter(x, y)

# Share an X-axis with each column of subplots
fig.subplots(2, 2, sharex='col')

# Share a Y-axis with each row of subplots
fig.subplots(2, 2, sharey='row')

# Share both X- and Y-axes with all subplots
fig.subplots(2, 2, sharex='all', sharey='all')

# Note that this is the same as
fig.subplots(2, 2, sharex=True, sharey=True)
- subplots_adjust(left=None, bottom=None, right=None, top=None, wspace=None, hspace=None)[source]#
Adjust the subplot layout parameters.
Unset parameters are left unmodified; initial values are given by
rcParams["figure.subplot.[name]"].(
Source code,png)
- Parameters:
- leftfloat, optional
The position of the left edge of the subplots, as a fraction of the figure width.
- rightfloat, optional
The position of the right edge of the subplots, as a fraction of the figure width.
- bottomfloat, optional
The position of the bottom edge of the subplots, as a fraction of the figure height.
- topfloat, optional
The position of the top edge of the subplots, as a fraction of the figure height.
- wspacefloat, optional
The width of the padding between subplots, as a fraction of the average Axes width.
- hspacefloat, optional
The height of the padding between subplots, as a fraction of the average Axes height.
- suptitle(t, **kwargs)[source]#
Add a centered super title to the figure.
- Parameters:
- tstr
The super title text.
- xfloat, default: 0.5
The x location of the text in figure coordinates.
- yfloat, default: 0.98
The y location of the text in figure coordinates.
- horizontalalignment, ha{'center', 'left', 'right'}, default: center
The horizontal alignment of the text relative to (x, y).
- verticalalignment, va{'top', 'center', 'bottom', 'baseline'}, default: top
The vertical alignment of the text relative to (x, y).
- fontsize, sizedefault:
rcParams["figure.titlesize"](default:'large') The font size of the text. See
Text.set_sizefor possible values.- fontweight, weightdefault:
rcParams["figure.titleweight"](default:'normal') The font weight of the text. See
Text.set_weightfor possible values.
- Returns:
- text
The
Textinstance of the super title.
- Other Parameters:
- fontpropertiesNone or dict, optional
A dict of font properties. If fontproperties is given the default values for font size and weight are taken from the
FontPropertiesdefaults.rcParams["figure.titlesize"](default:'large') andrcParams["figure.titleweight"](default:'normal') are ignored in this case.- **kwargs
Additional kwargs are
matplotlib.text.Textproperties.
- supxlabel(t, **kwargs)[source]#
Add a centered super xlabel to the figure.
- Parameters:
- tstr
The super xlabel text.
- xfloat, default: 0.5
The x location of the text in figure coordinates.
- yfloat, default: 0.01
The y location of the text in figure coordinates.
- horizontalalignment, ha{'center', 'left', 'right'}, default: center
The horizontal alignment of the text relative to (x, y).
- verticalalignment, va{'top', 'center', 'bottom', 'baseline'}, default: bottom
The vertical alignment of the text relative to (x, y).
- fontsize, sizedefault:
rcParams["figure.labelsize"](default:'large') The font size of the text. See
Text.set_sizefor possible values.- fontweight, weightdefault:
rcParams["figure.labelweight"](default:'normal') The font weight of the text. See
Text.set_weightfor possible values.
- Returns:
- text
The
Textinstance of the super xlabel.
- Other Parameters:
- fontpropertiesNone or dict, optional
A dict of font properties. If fontproperties is given the default values for font size and weight are taken from the
FontPropertiesdefaults.rcParams["figure.labelsize"](default:'large') andrcParams["figure.labelweight"](default:'normal') are ignored in this case.- **kwargs
Additional kwargs are
matplotlib.text.Textproperties.
- supylabel(t, **kwargs)[source]#
Add a centered super ylabel to the figure.
- Parameters:
- tstr
The super ylabel text.
- xfloat, default: 0.02
The x location of the text in figure coordinates.
- yfloat, default: 0.5
The y location of the text in figure coordinates.
- horizontalalignment, ha{'center', 'left', 'right'}, default: left
The horizontal alignment of the text relative to (x, y).
- verticalalignment, va{'top', 'center', 'bottom', 'baseline'}, default: center
The vertical alignment of the text relative to (x, y).
- fontsize, sizedefault:
rcParams["figure.labelsize"](default:'large') The font size of the text. See
Text.set_sizefor possible values.- fontweight, weightdefault:
rcParams["figure.labelweight"](default:'normal') The font weight of the text. See
Text.set_weightfor possible values.
- Returns:
- text
The
Textinstance of the super ylabel.
- Other Parameters:
- fontpropertiesNone or dict, optional
A dict of font properties. If fontproperties is given the default values for font size and weight are taken from the
FontPropertiesdefaults.rcParams["figure.labelsize"](default:'large') andrcParams["figure.labelweight"](default:'normal') are ignored in this case.- **kwargs
Additional kwargs are
matplotlib.text.Textproperties.
- text(x, y, s, fontdict=None, **kwargs)[source]#
Add text to figure.
- Parameters:
- x, yfloat
The position to place the text. By default, this is in figure coordinates, floats in [0, 1]. The coordinate system can be changed using the transform keyword.
- sstr
The text string.
- fontdictdict, optional
A dictionary to override the default text properties. If not given, the defaults are determined by
rcParams["font.*"]. Properties passed as kwargs override the corresponding ones given in fontdict.
- Returns:
- Other Parameters:
- **kwargs
Textproperties Other miscellaneous text parameters.
Property
Description
a filter function, which takes a (m, n, 3) float array and a dpi value, and returns a (m, n, 3) array and two offsets from the bottom left corner of the image
float or None
bool
bool
dict with properties for
FancyBboxPatchor Noneunknown
unknown
unknown
fontfamilyorfamilyorfontname{FONTNAME, 'serif', 'sans-serif', 'cursive', 'fantasy', 'monospace'}
list of str, or tuple of str, or None
float or {'xx-small', 'x-small', 'small', 'medium', 'large', 'x-large', 'xx-large'}
{a numeric value in range 0-1000, 'ultra-condensed', 'extra-condensed', 'condensed', 'semi-condensed', 'normal', 'semi-expanded', 'expanded', 'extra-expanded', 'ultra-expanded'}
{'normal', 'italic', 'oblique'}
{'normal', 'small-caps'}
fontweightorweight{a numeric value in range 0-1000, 'ultralight', 'light', 'normal', 'regular', 'book', 'medium', 'roman', 'semibold', 'demibold', 'demi', 'bold', 'heavy', 'extra bold', 'black'}
str
{'left', 'center', 'right'}
bool
object
str or None
'normal' or float, default: 'normal'
str
bool
multialignmentorma{'left', 'right', 'center'}
bool
list of
AbstractPathEffectNone or bool or float or callable
(float, float)
bool
float or {'vertical', 'horizontal'}
{None, 'default', 'anchor', 'xtick', 'ytick'}
(scale: float, length: float, randomness: float)
bool or None
object
bool
str
bool, default:
rcParams["text.usetex"](default:False){'baseline', 'bottom', 'center', 'center_baseline', 'top'}
bool
bool
float
float
float
- **kwargs
See also

Helper functions#
- matplotlib.figure.figaspect(arg)[source]#
Calculate the width and height for a figure with a specified aspect ratio.
While the height is taken from
rcParams["figure.figsize"](default:[6.4, 4.8]), the width is adjusted to match the desired aspect ratio. Additionally, it is ensured that the width is in the range [4., 16.] and the height is in the range [2., 16.]. If necessary, the default height is adjusted to ensure this.- Parameters:
- argfloat or 2D array
If a float, this defines the aspect ratio (i.e. the ratio height / width). In case of an array the aspect ratio is number of rows / number of columns, so that the array could be fitted in the figure undistorted.
- Returns:
- size(2,) array
The width and height of the figure in inches.
Notes
If you want to create an Axes within the figure, that still preserves the aspect ratio, be sure to create it with equal width and height. See examples below.
Thanks to Fernando Perez for this function.
Examples
Make a figure twice as tall as it is wide:
w, h = figaspect(2.)
fig = Figure(figsize=(w, h))
ax = fig.add_axes((0.1, 0.1, 0.8, 0.8))
ax.imshow(A, **kwargs)
Make a figure with the proper aspect for an array:
A = rand(5, 3)
w, h = figaspect(A)
fig = Figure(figsize=(w, h))
ax = fig.add_axes((0.1, 0.1, 0.8, 0.8))
ax.imshow(A, **kwargs)