matplotlib.axes.Axes.hexbin#
- Axes.hexbin(x, y, C=None, *, gridsize=100, bins=None, xscale='linear', yscale='linear', extent=None, cmap=None, norm=None, vmin=None, vmax=None, alpha=None, linewidths=None, edgecolors='face', reduce_C_function=<function mean>, mincnt=None, marginals=False, colorizer=None, data=None, **kwargs)[source]#
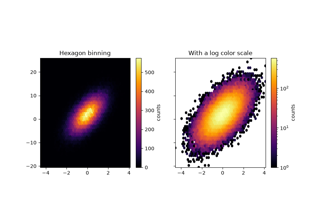
Make a 2D hexagonal binning plot of points x, y.
If C is None, the value of the hexagon is determined by the number of points in the hexagon. Otherwise, C specifies values at the coordinate (x[i], y[i]). For each hexagon, these values are reduced using reduce_C_function.
- Parameters:
- x, yarray-like
The data positions. x and y must be of the same length.
- Carray-like, optional
If given, these values are accumulated in the bins. Otherwise, every point has a value of 1. Must be of the same length as x and y.
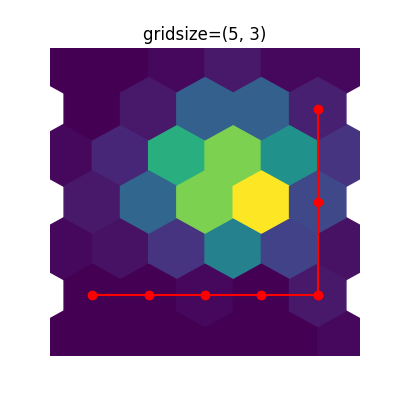
- gridsizeint or (int, int), default: 100
If a single int, the number of hexagons in the x-direction. The number of hexagons in the y-direction is chosen such that the hexagons are approximately regular.
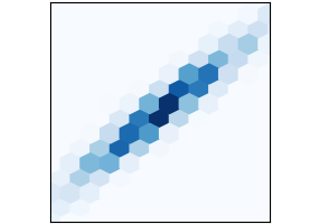
Alternatively, if a tuple (nx, ny), the number of hexagons in the x-direction and the y-direction. In the y-direction, counting is done along vertically aligned hexagons, not along the zig-zag chains of hexagons; see the following illustration.
(
Source code,2x.png,png)
To get approximately regular hexagons, choose \(n_x = \sqrt{3}\,n_y\).
- bins'log' or int or sequence, default: None
Discretization of the hexagon values.
If None, no binning is applied; the color of each hexagon directly corresponds to its count value.
If 'log', use a logarithmic scale for the colormap. Internally, \(log_{10}(i)\) is used to determine the hexagon color. This is equivalent to
norm=LogNorm(). Note that 0 counts are thus marked with the "bad" color.If an integer, divide the counts in the specified number of bins, and color the hexagons accordingly.
If a sequence of values, the values of the lower bound of the bins to be used.
- xscale{'linear', 'log'}, default: 'linear'
Use a linear or log10 scale on the horizontal axis.
- yscale{'linear', 'log'}, default: 'linear'
Use a linear or log10 scale on the vertical axis.
- mincntint >= 0, default: None
If not None, only display cells with at least mincnt number of points in the cell.
- marginalsbool, default: False
If marginals is True, plot the marginal density as colormapped rectangles along the bottom of the x-axis and left of the y-axis.
- extent4-tuple of float, default: None
The limits of the bins (xmin, xmax, ymin, ymax). The default assigns the limits based on gridsize, x, y, xscale and yscale.
If xscale or yscale is set to 'log', the limits are expected to be the exponent for a power of 10. E.g. for x-limits of 1 and 50 in 'linear' scale and y-limits of 10 and 1000 in 'log' scale, enter (1, 50, 1, 3).
- Returns:
PolyCollectionA
PolyCollectiondefining the hexagonal bins.PolyCollection.get_offsetscontains a Mx2 array containing the x, y positions of the M hexagon centers in data coordinates.PolyCollection.get_arraycontains the values of the M hexagons.
If marginals is True, horizontal bar and vertical bar (both PolyCollections) will be attached to the return collection as attributes hbar and vbar.
- Other Parameters:
- cmapstr or
Colormap, default:rcParams["image.cmap"](default:'viridis') The Colormap instance or registered colormap name used to map scalar data to colors.
- normstr or
Normalize, optional The normalization method used to scale scalar data to the [0, 1] range before mapping to colors using cmap. By default, a linear scaling is used, mapping the lowest value to 0 and the highest to 1.
If given, this can be one of the following:
An instance of
Normalizeor one of its subclasses (see Colormap normalization).A scale name, i.e. one of "linear", "log", "symlog", "logit", etc. For a list of available scales, call
matplotlib.scale.get_scale_names(). In that case, a suitableNormalizesubclass is dynamically generated and instantiated.
- vmin, vmaxfloat, optional
When using scalar data and no explicit norm, vmin and vmax define the data range that the colormap covers. By default, the colormap covers the complete value range of the supplied data. It is an error to use vmin/vmax when a norm instance is given (but using a
strnorm name together with vmin/vmax is acceptable).- alphafloat between 0 and 1, optional
The alpha blending value, between 0 (transparent) and 1 (opaque).
- linewidthsfloat, default: None
If None, defaults to
rcParams["patch.linewidth"](default:1.0).- edgecolors{'face', 'none', None} or color, default: 'face'
The color of the hexagon edges. Possible values are:
'face': Draw the edges in the same color as the fill color.
'none': No edges are drawn. This can sometimes lead to unsightly unpainted pixels between the hexagons.
None: Draw outlines in the default color.
An explicit color.
- reduce_C_functioncallable, default:
numpy.mean The function to aggregate C within the bins. It is ignored if C is not given. This must have the signature:
def reduce_C_function(C: array) -> float
Commonly used functions are:
numpy.mean: average of the pointsnumpy.sum: integral of the point valuesnumpy.amax: value taken from the largest point
By default will only reduce cells with at least 1 point because some reduction functions (such as
numpy.amax) will error/warn with empty input. Changing mincnt will adjust the cutoff, and if set to 0 will pass empty input to the reduction function.- colorizer
Colorizeror None, default: None The Colorizer object used to map color to data. If None, a Colorizer object is created from a norm and cmap.
- dataindexable object, optional
If given, the following parameters also accept a string
s, which is interpreted asdata[s]ifsis a key indata:x, y, C
- **kwargs
PolyCollectionproperties All other keyword arguments are passed on to
PolyCollection:Property
Description
a filter function, which takes a (m, n, 3) float array and a dpi value, and returns a (m, n, 3) array and two offsets from the bottom left corner of the image
array-like or float or None
bool
antialiasedoraaorantialiasedsbool or list of bools
array-like or None
CapStyleor {'butt', 'projecting', 'round'}(vmin: float, vmax: float)
BboxBaseor Nonebool
Patch or (Path, Transform) or None
Colormapor str or Nonecolor or list of RGBA tuples
edgecolororecoredgecolorsfacecolororfacecolorsorfcstr
{'/', '\', '|', '-', '+', 'x', 'o', 'O', '.', '*'}
unknown
bool
JoinStyleor {'miter', 'round', 'bevel'}object
linestyleordashesorlinestylesorls{'-', '--', '-.', ':', '', ...} or (offset, on-off-seq) or list thereof
linewidthorlinewidthsorlwfloat or list of floats
bool
Normalizeor str or None(N, 2) or (2,) array-like
list of
AbstractPathEffectlist of array-like
None or bool or float or callable
float
bool
numpy.ndarrayor None(scale: float, length: float, randomness: float)
bool or None
str
list of str or None
list of array-like
unknown
bool
float
- cmapstr or
See also
hist2d2D histogram rectangular bins
