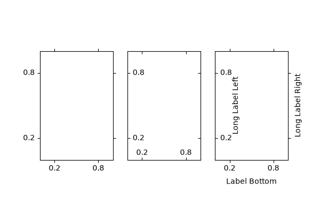
matplotlib.axes.Axes.set_yticks#
- Axes.set_yticks(ticks, labels=None, *, minor=False, **kwargs)[source]#
Set the yaxis' tick locations and optionally tick labels.
If necessary, the view limits of the Axis are expanded so that all given ticks are visible.
- Parameters:
- ticks1D array-like
Array of tick locations (either floats or in axis units). The axis
Locatoris replaced by aFixedLocator.Pass an empty list (
set_yticks([])) to remove all ticks.Some tick formatters will not label arbitrary tick positions; e.g. log formatters only label decade ticks by default. In such a case you can set a formatter explicitly on the axis using
Axis.set_major_formatteror provide formatted labels yourself.- labelslist of str, optional
Tick labels for each location in ticks; must have the same length as ticks. If set, the labels are used as is, via a
FixedFormatter. If not set, the labels are generated using the axis tickFormatter.- minorbool, default: False
If
False, set only the major ticks; ifTrue, only the minor ticks.- **kwargs
Textproperties for the labels. Using these is only allowed if you pass labels. In other cases, please usetick_params.
Notes
The mandatory expansion of the view limits is an intentional design choice to prevent the surprise of a non-visible tick. If you need other limits, you should set the limits explicitly after setting the ticks.
Examples using matplotlib.axes.Axes.set_yticks#


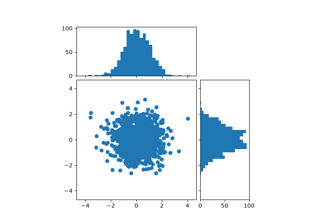
Align histogram to scatter plot using locatable Axes
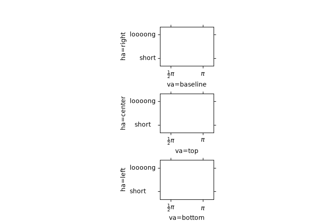


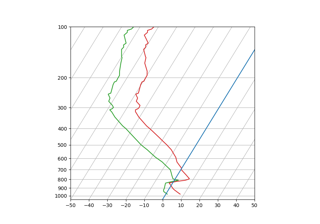
SkewT-logP diagram: using transforms and custom projections
