Note
Go to the end to download the full example code.
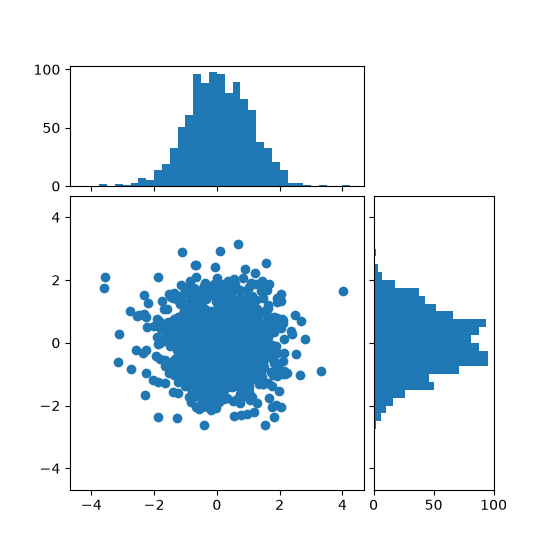
Align histogram to scatter plot using locatable Axes#
Show the marginal distributions of a scatter plot as histograms at the sides of the plot.
For a nice alignment of the main Axes with the marginals, the Axes positions
are defined by a Divider, produced via make_axes_locatable. Note that
the Divider API allows setting Axes sizes and pads in inches, which is its
main feature.
If one wants to set Axes sizes and pads relative to the main Figure, see the Scatter plot with histograms example.
import matplotlib.pyplot as plt
import numpy as np

from mpl_toolkits.axes_grid1 import make_axes_locatable

# Fixing random state for reproducibility
np.random.seed(19680801)

# the random data
x = np.random.randn(1000)
y = np.random.randn(1000)


fig, ax = plt.subplots(figsize=(5.5, 5.5))

# the scatter plot:
ax.scatter(x, y)

# Set aspect of the main Axes.
ax.set_aspect(1.)

# create new Axes on the right and on the top of the current Axes
divider = make_axes_locatable(ax)
# below height and pad are in inches
ax_histx = divider.append_axes("top", 1.2, pad=0.1, sharex=ax)
ax_histy = divider.append_axes("right", 1.2, pad=0.1, sharey=ax)

# make some labels invisible
ax_histx.xaxis.set_tick_params(labelbottom=False)
ax_histy.yaxis.set_tick_params(labelleft=False)

# now determine nice limits by hand:
binwidth = 0.25
xymax = max(np.max(np.abs(x)), np.max(np.abs(y)))
lim = (int(xymax/binwidth) + 1)*binwidth

bins = np.arange(-lim, lim + binwidth, binwidth)
ax_histx.hist(x, bins=bins)
ax_histy.hist(y, bins=bins, orientation='horizontal')

# the xaxis of ax_histx and yaxis of ax_histy are shared with ax,
# thus there is no need to manually adjust the xlim and ylim of these
# axis.

ax_histx.set_yticks([0, 50, 100])
ax_histy.set_xticks([0, 50, 100])

plt.show()
References
The use of the following functions, methods, classes and modules is shown in this example: