Note
Go to the end to download the full example code.
Pick event demo#
You can enable picking by setting the "picker" property of an artist (for example, a Matplotlib Line2D, Text, Patch, Polygon, AxesImage, etc.)
There are a variety of meanings of the picker property:
None - picking is disabled for this artist (default)
bool - if True then picking will be enabled and the artist will fire a pick event if the mouse event is over the artist.
Setting
pickradiuswill add an epsilon tolerance in points and the artist will fire off an event if its data is within epsilon of the mouse event. For some artists like lines and patch collections, the artist may provide additional data to the pick event that is generated, for example, the indices of the data within epsilon of the pick eventfunction - if picker is callable, it is a user supplied function which determines whether the artist is hit by the mouse event.
hit, props = picker(artist, mouseevent)
to determine the hit test. If the mouse event is over the artist, return hit=True and props is a dictionary of properties you want added to the PickEvent attributes.
After you have enabled an artist for picking by setting the "picker" property, you need to connect to the figure canvas pick_event to get pick callbacks on mouse press events. For example,
def pick_handler(event):
    mouseevent = event.mouseevent
    artist = event.artist
    # now do something with this...
The pick event (matplotlib.backend_bases.PickEvent) which is passed to your callback is always fired with two attributes:
- mouseevent
the mouse event that generate the pick event.
The mouse event in turn has attributes like x and y (the coordinates in display space, such as pixels from left, bottom) and xdata, ydata (the coords in data space). Additionally, you can get information about which buttons were pressed, which keys were pressed, which Axes the mouse is over, etc. See matplotlib.backend_bases.MouseEvent for details.
- artist
the matplotlib.artist that generated the pick event.
Additionally, certain artists like Line2D and PatchCollection may attach additional metadata like the indices into the data that meet the picker criteria (for example, all the points in the line that are within the specified epsilon tolerance)
The examples below illustrate each of these methods.
Note
These examples exercises the interactive capabilities of Matplotlib, and this will not appear in the static documentation. Please run this code on your machine to see the interactivity.
You can copy and paste individual parts, or download the entire example using the link at the bottom of the page.
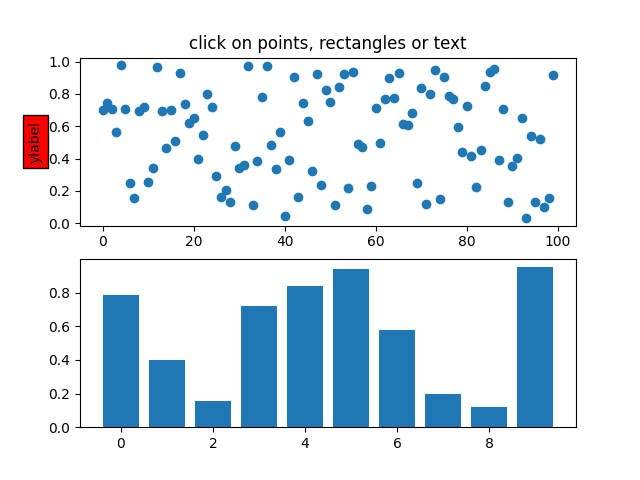
Simple picking, lines, rectangles and text#
fig, (ax1, ax2) = plt.subplots(2, 1)
ax1.set_title('click on points, rectangles or text', picker=True)
ax1.set_ylabel('ylabel', picker=True, bbox=dict(facecolor='red'))
line, = ax1.plot(rand(100), 'o', picker=True, pickradius=5)

# Pick the rectangle.
ax2.bar(range(10), rand(10), picker=True)
for label in ax2.get_xticklabels():  # Make the xtick labels pickable.
    label.set_picker(True)


def onpick1(event):
    if isinstance(event.artist, Line2D):
        thisline = event.artist
        xdata = thisline.get_xdata()
        ydata = thisline.get_ydata()
        ind = event.ind
        print('onpick1 line:', np.column_stack([xdata[ind], ydata[ind]]))
    elif isinstance(event.artist, Rectangle):
        patch = event.artist
        print('onpick1 patch:', patch.get_path())
    elif isinstance(event.artist, Text):
        text = event.artist
        print('onpick1 text:', text.get_text())


fig.canvas.mpl_connect('pick_event', onpick1)
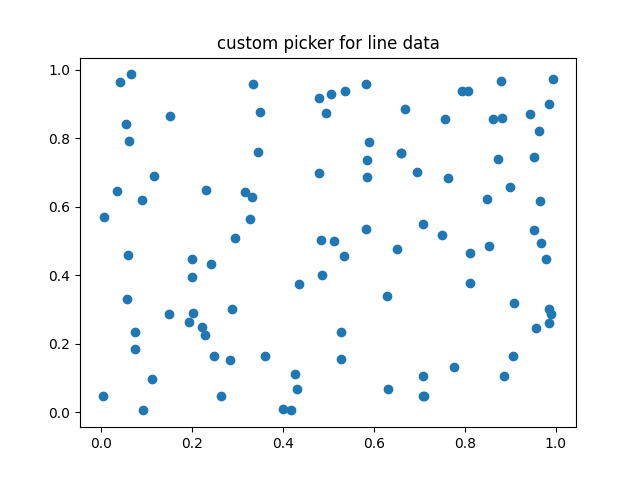
Picking with a custom hit test function#
You can define custom pickers by setting picker to a callable function. The function has the signature:
hit, props = func(artist, mouseevent)
to determine the hit test. If the mouse event is over the artist, return
hit=True and props is a dictionary of properties you want added to
the PickEvent attributes.
def line_picker(line, mouseevent):
    """
    Find the points within a certain distance from the mouseclick in
    data coords and attach some extra attributes, pickx and picky
    which are the data points that were picked.
    """
    if mouseevent.xdata is None:
        return False, dict()
    xdata = line.get_xdata()
    ydata = line.get_ydata()
    maxd = 0.05
    d = np.sqrt(
        (xdata - mouseevent.xdata)**2 + (ydata - mouseevent.ydata)**2)

    ind, = np.nonzero(d <= maxd)
    if len(ind):
        pickx = xdata[ind]
        picky = ydata[ind]
        props = dict(ind=ind, pickx=pickx, picky=picky)
        return True, props
    else:
        return False, dict()


def onpick2(event):
    print('onpick2 line:', event.pickx, event.picky)


fig, ax = plt.subplots()
ax.set_title('custom picker for line data')
line, = ax.plot(rand(100), rand(100), 'o', picker=line_picker)
fig.canvas.mpl_connect('pick_event', onpick2)
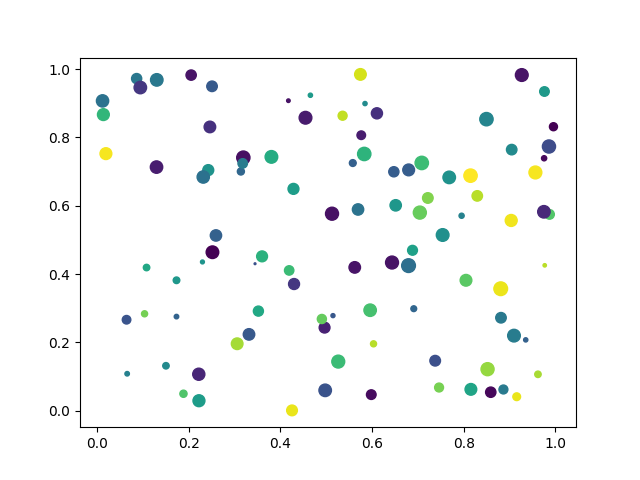
Picking on a scatter plot#
A scatter plot is backed by a PathCollection.
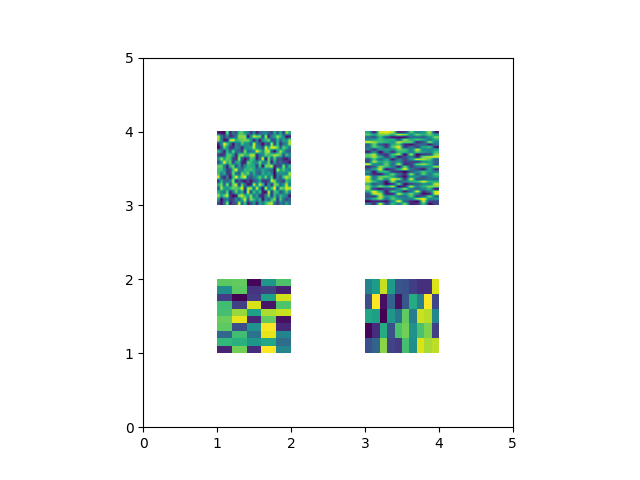
Picking images#
Images plotted using Axes.imshow are AxesImage
objects.
fig, ax = plt.subplots()
ax.imshow(rand(10, 5), extent=(1, 2, 1, 2), picker=True)
ax.imshow(rand(5, 10), extent=(3, 4, 1, 2), picker=True)
ax.imshow(rand(20, 25), extent=(1, 2, 3, 4), picker=True)
ax.imshow(rand(30, 12), extent=(3, 4, 3, 4), picker=True)
ax.set(xlim=(0, 5), ylim=(0, 5))


def onpick4(event):
    artist = event.artist
    if isinstance(artist, AxesImage):
        im = artist
        A = im.get_array()
        print('onpick4 image', A.shape)


fig.canvas.mpl_connect('pick_event', onpick4)

plt.show()
Total running time of the script: (0 minutes 1.127 seconds)