Note
Go to the end to download the full example code.
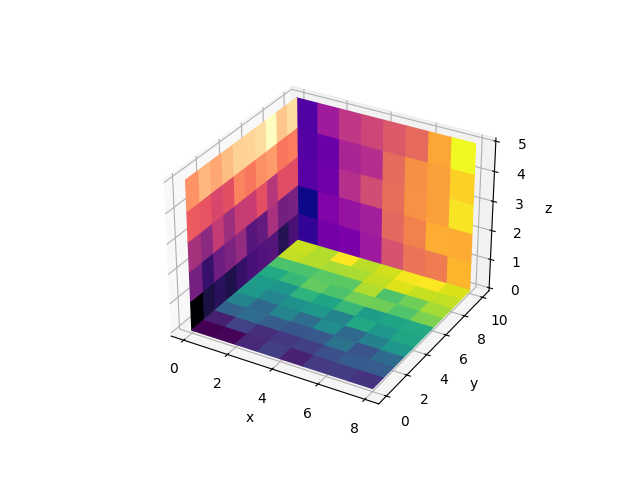
2D images in 3D#
This example demonstrates how to plot 2D color coded images (similar to
Axes.imshow) as a plane in 3D.
Matplotlib does not have a native function for this. Below we build one by relying
on Axes3D.plot_surface. For simplicity, there are some differences to
Axes.imshow: This function does not set the aspect of the Axes, hence pixels are
not necessarily square. Also, pixel edges are on integer values rather than pixel
centers. Furthermore, many optional parameters of Axes.imshow are not implemented.
Multiple calls of imshow3d use independent norms and thus different color scales
by default. If you want to have a single common color scale, you need to construct
a suitable norm beforehand and pass it to all imshow3d calls.
A fundamental limitation of the 3D plotting engine is that intersecting objects cannot be drawn correctly. One object will always be drawn after the other. Therefore, multiple image planes can well be used in the background as shown in this example. But this approach is not suitable if the planes intersect.
import matplotlib.pyplot as plt
import numpy as np

from matplotlib.colors import Normalize


def imshow3d(ax, array, value_direction='z', pos=0, norm=None, cmap=None):
    """
    Display a 2D array as a  color-coded 2D image embedded in 3d.

    The image will be in a plane perpendicular to the coordinate axis *value_direction*.

    Parameters
    ----------
    ax : Axes3D
        The 3D Axes to plot into.
    array : 2D numpy array
        The image values.
    value_direction : {'x', 'y', 'z'}
        The axis normal to the image plane.
    pos : float
        The numeric value on the *value_direction* axis at which the image plane is
        located.
    norm : `~matplotlib.colors.Normalize`, default: Normalize
        The normalization method used to scale scalar data. See `imshow()`.
    cmap : str or `~matplotlib.colors.Colormap`, default: :rc:`image.cmap`
        The Colormap instance or registered colormap name used to map scalar data
        to colors.
    """
    if norm is None:
        norm = Normalize()
    colors = plt.get_cmap(cmap)(norm(array))

    if value_direction == 'x':
        nz, ny = array.shape
        zi, yi = np.mgrid[0:nz + 1, 0:ny + 1]
        xi = np.full_like(yi, pos)
    elif value_direction == 'y':
        nx, nz = array.shape
        xi, zi = np.mgrid[0:nx + 1, 0:nz + 1]
        yi = np.full_like(zi, pos)
    elif value_direction == 'z':
        ny, nx = array.shape
        yi, xi = np.mgrid[0:ny + 1, 0:nx + 1]
        zi = np.full_like(xi, pos)
    else:
        raise ValueError(f"Invalid value_direction: {value_direction!r}")
    ax.plot_surface(xi, yi, zi, rstride=1, cstride=1, facecolors=colors, shade=False)


fig = plt.figure()
ax = fig.add_subplot(projection='3d')
ax.set(xlabel="x", ylabel="y", zlabel="z")

nx, ny, nz = 8, 10, 5
data_xy = np.arange(ny * nx).reshape(ny, nx) + 15 * np.random.random((ny, nx))
data_yz = np.arange(nz * ny).reshape(nz, ny) + 10 * np.random.random((nz, ny))
data_zx = np.arange(nx * nz).reshape(nx, nz) + 8 * np.random.random((nx, nz))

imshow3d(ax, data_xy)
imshow3d(ax, data_yz, value_direction='x', cmap='magma')
imshow3d(ax, data_zx, value_direction='y', pos=ny, cmap='plasma')

plt.show()