Note
Go to the end to download the full example code.
Major and minor ticks#
Demonstrate how to use major and minor tickers.
The two relevant classes are Locators and Formatters. Locators
determine where the ticks are, and formatters control the formatting of tick
labels.
Minor ticks are off by default (using NullLocator and NullFormatter).
Minor ticks can be turned on without labels by setting the minor locator.
Minor tick labels can be turned on by setting the minor formatter.
MultipleLocator places ticks on multiples of some base.
StrMethodFormatter uses a format string (e.g., '{x:d}' or '{x:1.2f}'
or '{x:1.1f} cm') to format the tick labels (the variable in the format
string must be 'x'). For a StrMethodFormatter, the string can be passed
directly to Axis.set_major_formatter or
Axis.set_minor_formatter. An appropriate StrMethodFormatter will
be created and used automatically.
pyplot.grid changes the grid settings of the major ticks of the x- and
y-axis together. If you want to control the grid of the minor ticks for a
given axis, use for example
ax.xaxis.grid(True, which='minor')
Note that a given locator or formatter instance can only be used on a single axis (because the locator stores references to the axis data and view limits).
import matplotlib.pyplot as plt
import numpy as np
from matplotlib.ticker import AutoMinorLocator, MultipleLocator
t = np.arange(0.0, 100.0, 0.1)
s = np.sin(0.1 * np.pi * t) * np.exp(-t * 0.01)
fig, ax = plt.subplots()
ax.plot(t, s)
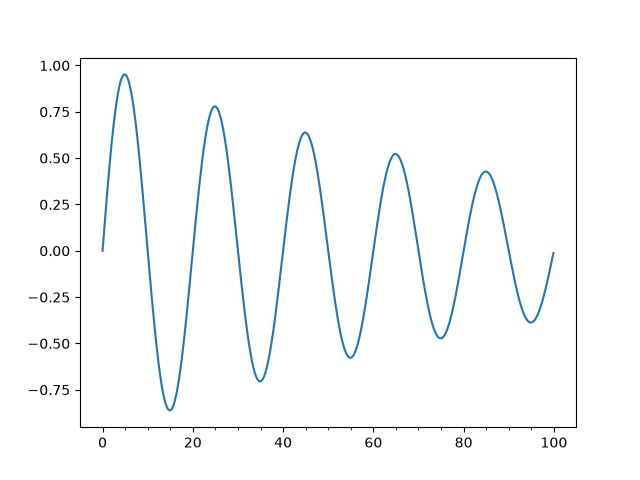
# Make a plot with major ticks that are multiples of 20 and minor ticks that
# are multiples of 5. Label major ticks with '.0f' formatting but don't label
# minor ticks. The string is used directly, the `StrMethodFormatter` is
# created automatically.
ax.xaxis.set_major_locator(MultipleLocator(20))
ax.xaxis.set_major_formatter('{x:.0f}')
# For the minor ticks, use no labels; default NullFormatter.
ax.xaxis.set_minor_locator(MultipleLocator(5))
plt.show()
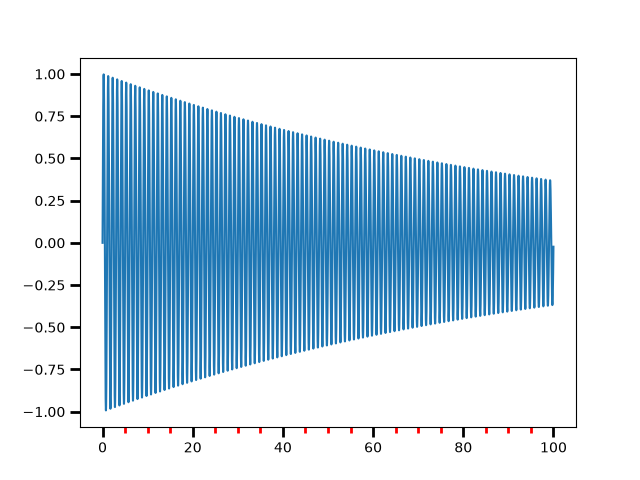
Automatic tick selection for major and minor ticks.
Use interactive pan and zoom to see how the tick intervals change. There will be either 4 or 5 minor tick intervals per major interval, depending on the major interval.
One can supply an argument to AutoMinorLocator to specify a fixed number
of minor intervals per major interval, e.g. AutoMinorLocator(2) would
lead to a single minor tick between major ticks.
t = np.arange(0.0, 100.0, 0.01)
s = np.sin(2 * np.pi * t) * np.exp(-t * 0.01)

fig, ax = plt.subplots()
ax.plot(t, s)

ax.xaxis.set_minor_locator(AutoMinorLocator())

ax.tick_params(which='both', width=2)
ax.tick_params(which='major', length=7)
ax.tick_params(which='minor', length=4, color='r')

plt.show()
References
The use of the following functions, methods, classes and modules is shown in this example: