Note
Go to the end to download the full example code.
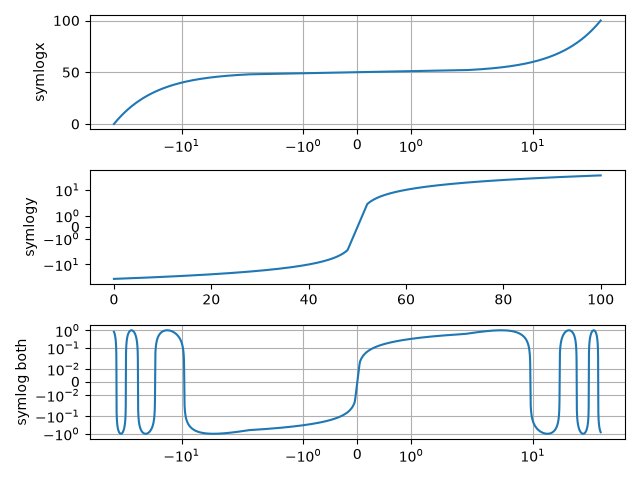
Symlog scale#
The symmetric logarithmic scale is an extension of the logarithmic scale that also covers negative values. As with the logarithmic scale, it is particularly useful for numerical data that spans a broad range of values, especially when there are significant differences between the magnitudes of the numbers involved.
Example use of symlog (symmetric log) axis scaling.
import matplotlib.pyplot as plt
import numpy as np

dt = 0.01
x = np.arange(-50.0, 50.0, dt)
y = np.arange(0, 100.0, dt)

fig, (ax0, ax1, ax2) = plt.subplots(nrows=3)

ax0.plot(x, y)
ax0.set_xscale('symlog')
ax0.set_ylabel('symlogx')
ax0.grid()
ax0.xaxis.grid(which='minor')  # minor grid on too

ax1.plot(y, x)
ax1.set_yscale('symlog')
ax1.set_ylabel('symlogy')

ax2.plot(x, np.sin(x / 3.0))
ax2.set_xscale('symlog')
ax2.set_yscale('symlog', linthresh=0.015)
ax2.grid()
ax2.set_ylabel('symlog both')

fig.tight_layout()
plt.show()
Linear threshold#
Since each decade on a logarithmic scale covers the same amount of visual space and there are infinitely many decades between a given number and zero, the symlog scale must deviate from logarithmic mapping in a small range (-linthresh, linthresh), so that the range is mapped to a finite visual space.
def format_axes(ax, title=None):
    """A helper function to better visualize properties of the symlog scale."""
    ax.xaxis.get_minor_locator().set_params(subs=[2, 3, 4, 5, 6, 7, 8, 9])
    ax.grid()
    ax.xaxis.grid(which='minor')  # minor grid on too
    linthresh = ax.xaxis.get_transform().linthresh
    linscale = ax.xaxis.get_transform().linscale
    ax.axvspan(-linthresh, linthresh, color='0.9')
    if title:
        ax.set_title(title.format(linthresh=linthresh, linscale=linscale))


x = np.linspace(-60, 60, 201)
y = np.linspace(0, 100.0, 201)

fig, (ax1, ax2) = plt.subplots(nrows=2, layout="constrained")

ax1.plot(x, y)
ax1.set_xscale('symlog', linthresh=1)
format_axes(ax1, title='Linear region: linthresh={linthresh}')

ax2.plot(x, y)
ax2.set_xscale('symlog', linthresh=5)
format_axes(ax2, title='Linear region: linthresh={linthresh}')

Generally, linthresh should be chosen so that no or only a few data points are in the linear region. As a rule of thumb, \(linthresh \approx \mathrm{min} |x|\).
Linear scale#
Additionally, the linscale parameter determines how much visual space should be used for the linear range. More precisely, it defines the ratio of visual space of the region (0, linthresh) relative to one decade.
fig, (ax1, ax2) = plt.subplots(nrows=2, layout="constrained")

ax1.plot(x, y)
ax1.set_xscale('symlog', linthresh=1)
format_axes(ax1, title='Linear region: linthresh={linthresh}, linscale={linscale}')

ax2.plot(x, y)
ax2.set_xscale('symlog', linthresh=1, linscale=0.1)
format_axes(ax2, title='Linear region: linthresh={linthresh}, linscale={linscale}')

The suitable value for linscale depends on the dynamic range of data. As most data will be outside the linear region, you typically the linear region only to cover a small fraction of the visual area.
Limitations and alternatives#
The coordinate transform used by symlog has a discontinuous gradient at the
transition between its linear and logarithmic regions. Depending on data and
scaling, this will be more or less obvious in the plot.
fig, ax = plt.subplots()
ax.plot(x, y)
ax.set_xscale('symlog', linscale=0.05)
format_axes(ax, title="Discontinuous gradient at linear/log transition")

The asinh axis scale is an alternative transformation that supports a wide
dynamic range with a smooth gradient and thus may avoid such visual artifacts.
See Asinh scale.
References
Total running time of the script: (0 minutes 2.740 seconds)