Note
Go to the end to download the full example code.
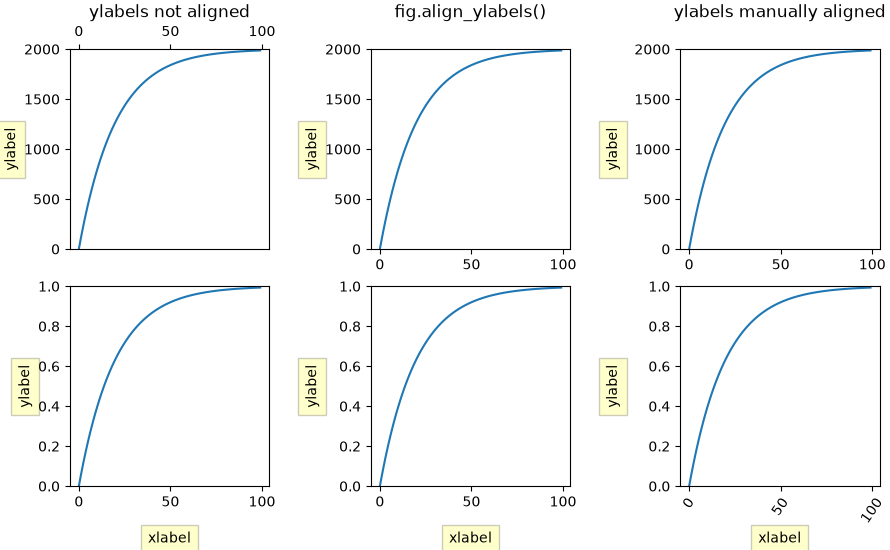
Align labels and titles#
Aligning xlabel, ylabel, and title using Figure.align_xlabels,
Figure.align_ylabels, and Figure.align_titles.
Figure.align_labels wraps the x and y label functions.
We align the xlabels and ylabels using short calls to Figure.align_xlabels
and Figure.align_ylabels. We also show a manual way to align the ylabels
using the set_label_coords method of the yaxis object. Note this requires
knowing a good offset value which is hardcoded.
import matplotlib.pyplot as plt
import numpy as np

fig, axs = plt.subplots(2, 3, figsize=(8.9, 5.5),
                        layout='constrained', gridspec_kw={'wspace': 0.1})

# add sample data and labels
for ax in axs.flat:
    scale = 2000 if ax.get_subplotspec().is_first_row() else 1
    ax.plot(scale * (1 - np.exp(-np.linspace(0, 5, 100))))
    if ax.get_subplotspec().is_last_row():
        ax.set_xlabel('xlabel', bbox=dict(facecolor='yellow', pad=5, alpha=0.2))
    ax.set_ylabel('ylabel', bbox=dict(facecolor='yellow', pad=5, alpha=0.2))
    ax.set_ylim(0, scale)

# Modify ticks to get different margins in some plots
axs[0, 0].xaxis.tick_top()
axs[1, 2].tick_params(axis='x', rotation=55)
axs[0, 0].set_title('ylabels not aligned')

# Align labels
fig.align_titles()            # Align titles
fig.align_xlabels()           # Align all x-axis labels
fig.align_ylabels(axs[:, 1])  # Align only the second column's y-labels
axs[0, 1].set_title('fig.align_ylabels()')

# Manually adjust y-labels for the third column
for ax in axs[:, 2]:
    ax.yaxis.set_label_coords(-0.3, 0.5)
axs[0, 2].set_title('ylabels manually aligned')

plt.show()
References
The use of the following functions, methods, classes and modules is shown in this example:
Total running time of the script: (0 minutes 1.607 seconds)