Note
Go to the end to download the full example code.
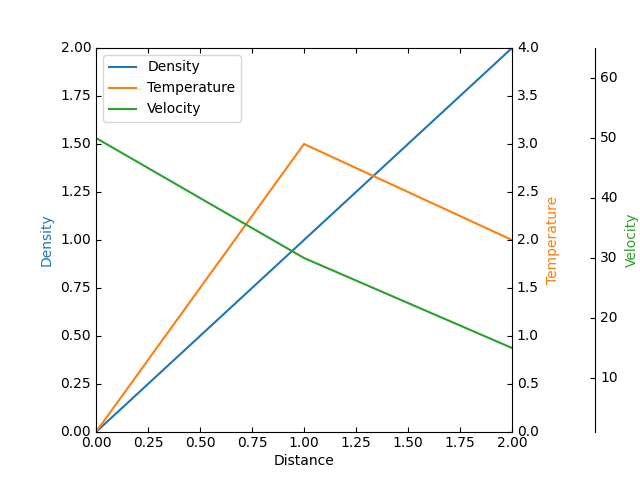
Parasite Axes demo#
Create a parasite Axes. Such Axes would share the x scale with a host Axes, but show a different scale in y direction.
This approach uses mpl_toolkits.axes_grid1.parasite_axes.HostAxes and
mpl_toolkits.axes_grid1.parasite_axes.ParasiteAxes.
The standard and recommended approach is to use instead standard Matplotlib axes, as shown in the Multiple y-axis with Spines example.
An alternative approach using mpl_toolkits.axes_grid1 and
mpl_toolkits.axisartist is shown in the
Parasite axis demo example.
import matplotlib.pyplot as plt

from mpl_toolkits.axisartist.parasite_axes import HostAxes

fig = plt.figure()

host = fig.add_axes((0.15, 0.1, 0.65, 0.8), axes_class=HostAxes)
par1 = host.get_aux_axes(viewlim_mode=None, sharex=host)
par2 = host.get_aux_axes(viewlim_mode=None, sharex=host)

host.axis["right"].set_visible(False)

par1.axis["right"].set_visible(True)
par1.axis["right"].major_ticklabels.set_visible(True)
par1.axis["right"].label.set_visible(True)

par2.axis["right2"] = par2.new_fixed_axis(loc="right", offset=(60, 0))

p1, = host.plot([0, 1, 2], [0, 1, 2], label="Density")
p2, = par1.plot([0, 1, 2], [0, 3, 2], label="Temperature")
p3, = par2.plot([0, 1, 2], [50, 30, 15], label="Velocity")

host.set(xlim=(0, 2), ylim=(0, 2), xlabel="Distance", ylabel="Density")
par1.set(ylim=(0, 4), ylabel="Temperature")
par2.set(ylim=(1, 65), ylabel="Velocity")

host.legend()

host.axis["left"].label.set_color(p1.get_color())
par1.axis["right"].label.set_color(p2.get_color())
par2.axis["right2"].label.set_color(p3.get_color())

plt.show()