Note
Go to the end to download the full example code.
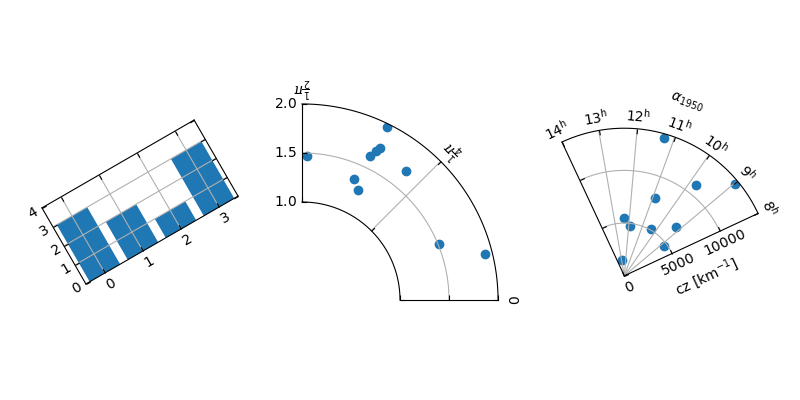
floating_axes features#
Demonstration of features of the floating_axes module:
Using
GridHelperCurveLinearto rotate the plot and set the plot boundary.Using
add_subplotto create a subplot using the return value fromGridHelperCurveLinear.Making a sector plot by adding more features to
GridHelperCurveLinear.
import matplotlib.pyplot as plt
import numpy as np

from matplotlib.projections import PolarAxes
from matplotlib.transforms import Affine2D
import mpl_toolkits.axisartist.angle_helper as angle_helper
import mpl_toolkits.axisartist.floating_axes as floating_axes
from mpl_toolkits.axisartist.grid_finder import DictFormatter, FixedLocator, MaxNLocator

# Fixing random state for reproducibility
np.random.seed(19680801)


def setup_axes1(fig, rect):
    """
    A simple one.
    """
    tr = Affine2D().scale(2, 1).rotate_deg(30)

    grid_helper = floating_axes.GridHelperCurveLinear(
        tr, extremes=(-0.5, 3.5, 0, 4),
        grid_locator1=MaxNLocator(nbins=4),
        grid_locator2=MaxNLocator(nbins=4))

    ax1 = fig.add_subplot(
        rect, axes_class=floating_axes.FloatingAxes, grid_helper=grid_helper)
    ax1.grid()

    aux_ax = ax1.get_aux_axes(tr)

    return ax1, aux_ax


def setup_axes2(fig, rect):
    """
    With custom locator and formatter.
    Note that the extreme values are swapped.
    """
    tr = PolarAxes.PolarTransform()

    pi = np.pi
    angle_ticks = {
        0: r"$0$",
        pi/4: r"$\frac{1}{4}\pi$",
        pi/2: r"$\frac{1}{2}\pi$",
    }
    grid_helper = floating_axes.GridHelperCurveLinear(
        tr, extremes=(.5*pi, 0, 2, 1),
        grid_locator1=FixedLocator([*angle_ticks]),
        tick_formatter1=DictFormatter(angle_ticks),
        grid_locator2=MaxNLocator(2),
        tick_formatter2=None,
    )
    ax1 = fig.add_subplot(
        rect, axes_class=floating_axes.FloatingAxes, grid_helper=grid_helper)
    ax1.grid()

    # create a parasite Axes whose transData in RA, cz
    aux_ax = ax1.get_aux_axes(tr)

    aux_ax.patch = ax1.patch  # for aux_ax to have a clip path as in ax
    ax1.patch.zorder = 0.9  # but this has a side effect that the patch is
    # drawn twice, and possibly over some other
    # artists. So, we decrease the zorder a bit to
    # prevent this.

    return ax1, aux_ax


def setup_axes3(fig, rect):
    """
    Sometimes, things like axis_direction need to be adjusted.
    """

    tr_rotate = Affine2D().translate(-95, 0)  # rotate a bit for better orientation
    tr_scale = Affine2D().scale(np.pi/180., 1.)  # scale degree to radians
    tr = tr_rotate + tr_scale + PolarAxes.PolarTransform()

    # Specify theta limits in degrees
    ra0, ra1 = 8.*15, 14.*15
    # Specify radial limits
    cz0, cz1 = 0, 14000

    grid_helper = floating_axes.GridHelperCurveLinear(
        tr, extremes=(ra0, ra1, cz0, cz1),
        grid_locator1=angle_helper.LocatorHMS(4),
        tick_formatter1=angle_helper.FormatterHMS(),
        grid_locator2=MaxNLocator(3),
        tick_formatter2=None,
    )
    ax1 = fig.add_subplot(
        rect, axes_class=floating_axes.FloatingAxes, grid_helper=grid_helper)

    # adjust axis
    ax1.axis["left"].set_axis_direction("bottom")
    ax1.axis["right"].set_axis_direction("top")

    ax1.axis["bottom"].set_visible(False)
    ax1.axis["top"].set_axis_direction("bottom")
    ax1.axis["top"].toggle(ticklabels=True, label=True)
    ax1.axis["top"].major_ticklabels.set_axis_direction("top")
    ax1.axis["top"].label.set_axis_direction("top")

    ax1.axis["left"].label.set_text(r"cz [km$^{-1}$]")
    ax1.axis["top"].label.set_text(r"$\alpha_{1950}$")
    ax1.grid()

    # create a parasite Axes whose transData in RA, cz
    aux_ax = ax1.get_aux_axes(tr)

    aux_ax.patch = ax1.patch  # for aux_ax to have a clip path as in ax
    ax1.patch.zorder = 0.9  # but this has a side effect that the patch is
    # drawn twice, and possibly over some other
    # artists. So, we decrease the zorder a bit to
    # prevent this.

    return ax1, aux_ax
fig = plt.figure(figsize=(8, 4))
fig.subplots_adjust(wspace=0.3, left=0.05, right=0.95)

ax1, aux_ax1 = setup_axes1(fig, 131)
aux_ax1.bar([0, 1, 2, 3], [3, 2, 1, 3])

ax2, aux_ax2 = setup_axes2(fig, 132)
theta = np.random.rand(10)*.5*np.pi
radius = np.random.rand(10) + 1.
aux_ax2.scatter(theta, radius)

ax3, aux_ax3 = setup_axes3(fig, 133)

theta = (8 + np.random.rand(10)*(14 - 8))*15.  # in degrees
radius = np.random.rand(10)*14000.
aux_ax3.scatter(theta, radius)

plt.show()