Note
Go to the end to download the full example code.
Date precision and epochs#
Matplotlib can handle datetime objects and numpy.datetime64 objects using
a unit converter that recognizes these dates and converts them to floating
point numbers.
Before Matplotlib 3.3, the default for this conversion returns a float that was days since "0000-12-31T00:00:00". As of Matplotlib 3.3, the default is days from "1970-01-01T00:00:00". This allows more resolution for modern dates. "2020-01-01" with the old epoch converted to 730120, and a 64-bit floating point number has a resolution of 2^{-52}, or approximately 14 microseconds, so microsecond precision was lost. With the new default epoch "2020-01-01" is 10957.0, so the achievable resolution is 0.21 microseconds.
import datetime

import matplotlib.pyplot as plt
import numpy as np

import matplotlib.dates as mdates


def _reset_epoch_for_tutorial():
    """
    Users (and downstream libraries) should not use the private method of
    resetting the epoch.
    """
    mdates._reset_epoch_test_example()
Datetime#
Python datetime objects have microsecond resolution, so with the
old default matplotlib dates could not round-trip full-resolution datetime
objects.
old_epoch = '0000-12-31T00:00:00'
new_epoch = '1970-01-01T00:00:00'

_reset_epoch_for_tutorial()  # Don't do this.  Just for this tutorial.
mdates.set_epoch(old_epoch)  # old epoch (pre MPL 3.3)

date1 = datetime.datetime(2000, 1, 1, 0, 10, 0, 12,
                          tzinfo=datetime.timezone.utc)
mdate1 = mdates.date2num(date1)
print('Before Roundtrip: ', date1, 'Matplotlib date:', mdate1)
date2 = mdates.num2date(mdate1)
print('After Roundtrip:  ', date2)
Before Roundtrip:  2000-01-01 00:10:00.000012+00:00 Matplotlib date: 730120.0069444446
After Roundtrip:   2000-01-01 00:10:00.000020+00:00
Note this is only a round-off error, and there is no problem for dates closer to the old epoch:
date1 = datetime.datetime(10, 1, 1, 0, 10, 0, 12,
                          tzinfo=datetime.timezone.utc)
mdate1 = mdates.date2num(date1)
print('Before Roundtrip: ', date1, 'Matplotlib date:', mdate1)
date2 = mdates.num2date(mdate1)
print('After Roundtrip:  ', date2)
Before Roundtrip:  0010-01-01 00:10:00.000012+00:00 Matplotlib date: 3288.006944444583
After Roundtrip:   0010-01-01 00:10:00.000012+00:00
If a user wants to use modern dates at microsecond precision, they
can change the epoch using set_epoch. However, the epoch has to be
set before any date operations to prevent confusion between different
epochs. Trying to change the epoch later will raise a RuntimeError.
try:
    mdates.set_epoch(new_epoch)  # this is the new MPL 3.3 default.
except RuntimeError as e:
    print('RuntimeError:', str(e))
RuntimeError: set_epoch must be called before dates plotted.
For this tutorial, we reset the sentinel using a private method, but users should just set the epoch once, if at all.
_reset_epoch_for_tutorial()  # Just being done for this tutorial.
mdates.set_epoch(new_epoch)

date1 = datetime.datetime(2020, 1, 1, 0, 10, 0, 12,
                          tzinfo=datetime.timezone.utc)
mdate1 = mdates.date2num(date1)
print('Before Roundtrip: ', date1, 'Matplotlib date:', mdate1)
date2 = mdates.num2date(mdate1)
print('After Roundtrip:  ', date2)
Before Roundtrip:  2020-01-01 00:10:00.000012+00:00 Matplotlib date: 18262.006944444583
After Roundtrip:   2020-01-01 00:10:00.000012+00:00
datetime64#
numpy.datetime64 objects have microsecond precision for a much larger
timespace than datetime objects. However, currently Matplotlib time is
only converted back to datetime objects, which have microsecond resolution,
and years that only span 0000 to 9999.
_reset_epoch_for_tutorial()  # Don't do this.  Just for this tutorial.
mdates.set_epoch(new_epoch)

date1 = np.datetime64('2000-01-01T00:10:00.000012')
mdate1 = mdates.date2num(date1)
print('Before Roundtrip: ', date1, 'Matplotlib date:', mdate1)
date2 = mdates.num2date(mdate1)
print('After Roundtrip:  ', date2)
Before Roundtrip:  2000-01-01T00:10:00.000012 Matplotlib date: 10957.006944444583
After Roundtrip:   2000-01-01 00:10:00.000012+00:00
Plotting#
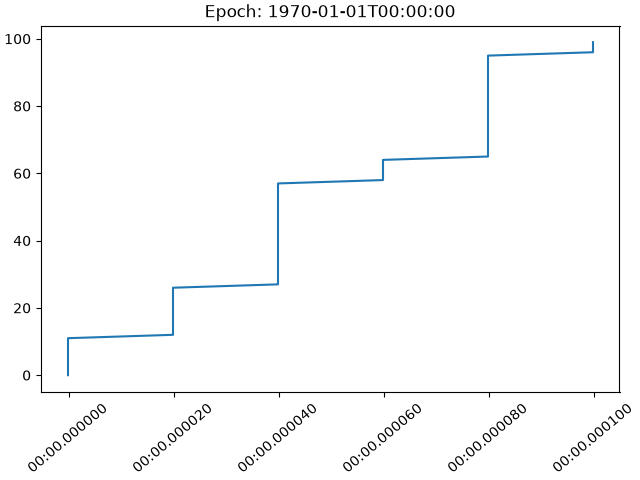
This all of course has an effect on plotting. With the old default epoch
the times were rounded during the internal date2num conversion, leading
to jumps in the data:
_reset_epoch_for_tutorial()  # Don't do this.  Just for this tutorial.
mdates.set_epoch(old_epoch)

x = np.arange('2000-01-01T00:00:00.0', '2000-01-01T00:00:00.000100',
              dtype='datetime64[us]')
# simulate the plot being made using the old epoch
xold = np.array([mdates.num2date(mdates.date2num(d)) for d in x])
y = np.arange(0, len(x))

# resetting the Epoch so plots are comparable
_reset_epoch_for_tutorial()  # Don't do this.  Just for this tutorial.
mdates.set_epoch(new_epoch)

fig, ax = plt.subplots(layout='constrained')
ax.plot(xold, y)
ax.set_title('Epoch: ' + mdates.get_epoch())
ax.xaxis.set_tick_params(rotation=40)
plt.show()
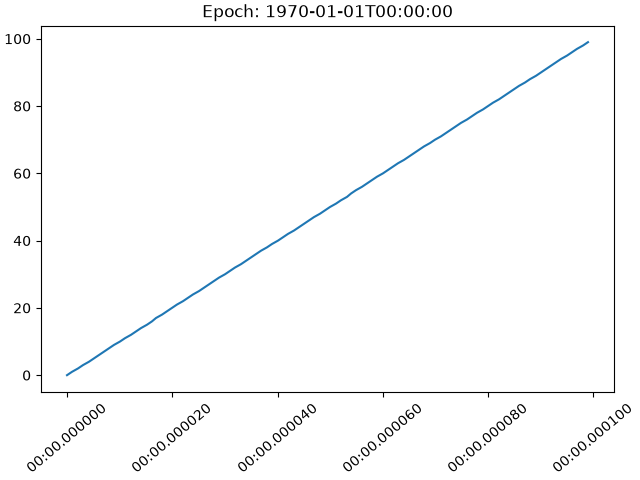
For dates plotted using the more recent epoch, the plot is smooth:
fig, ax = plt.subplots(layout='constrained')
ax.plot(x, y)
ax.set_title('Epoch: ' + mdates.get_epoch())
ax.xaxis.set_tick_params(rotation=40)
plt.show()

_reset_epoch_for_tutorial()  # Don't do this.  Just for this tutorial.
References
The use of the following functions, methods, classes and modules is shown in this example: