Note
Go to the end to download the full example code.
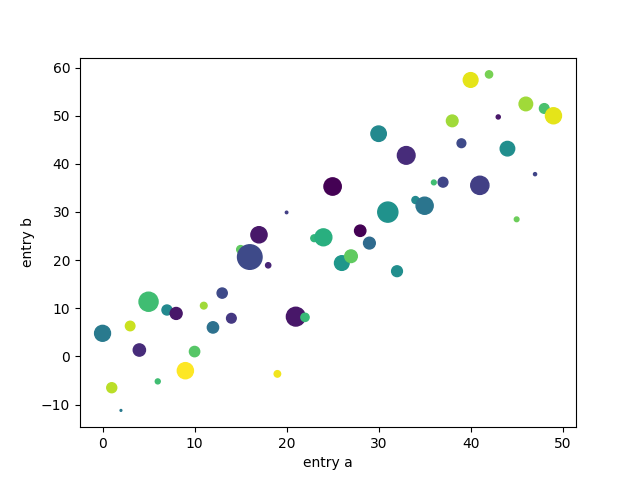
Plotting with keywords#
Some data structures, like dict, structured numpy array
or pandas.DataFrame provide access to labelled data via string index access
data[key].
For these data types, Matplotlib supports passing the whole datastructure via the
data keyword argument, and using the string names as plot function parameters,
where you'd normally pass in your data.
import matplotlib.pyplot as plt
import numpy as np

np.random.seed(19680801)

data = {'a': np.arange(50),
        'c': np.random.randint(0, 50, 50),
        'd': np.random.randn(50)}
data['b'] = data['a'] + 10 * np.random.randn(50)
data['d'] = np.abs(data['d']) * 100

fig, ax = plt.subplots()
ax.scatter('a', 'b', c='c', s='d', data=data)
ax.set(xlabel='entry a', ylabel='entry b')
plt.show()