Note
Go to the end to download the full example code.
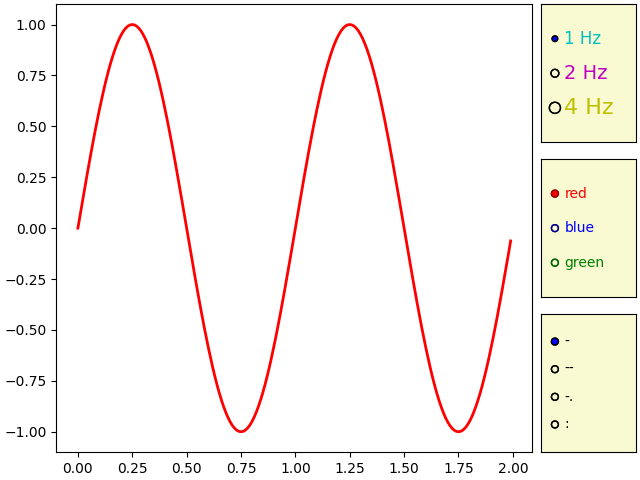
Radio Buttons#
Using radio buttons to choose properties of your plot.
Radio buttons let you choose between multiple options in a visualization. In this case, the buttons let the user choose one of the three different sine waves to be shown in the plot.
Radio buttons may be styled using the label_props and radio_props parameters, which each take a dictionary with keys of artist property names and values of lists of settings with length matching the number of buttons.
import matplotlib.pyplot as plt
import numpy as np

from matplotlib.widgets import RadioButtons

FREQUENCIES = {'1 Hz': 1, '2 Hz': 2, '4 Hz': 4}

t = np.arange(0.0, 2.0, 0.01)


def f(t, freq):
    return np.sin(2 * np.pi * freq * t)

fig, axd = plt.subplot_mosaic(
    [
        ['main', 'freq'],
        ['main', 'color'],
        ['main', 'linestyle'],
    ],
    width_ratios=[5, 1],
    layout='constrained',
)
(line,) = axd['main'].plot(t, f(t, freq=1), lw=2, color='red')
axd['main'].set(xlabel="Time (s)", ylabel="Amplitude", title="Sine Wave")

background_color = '0.95'
edge_color = '0.8'

axd['freq'].set_facecolor(background_color)
axd['freq'].spines[:].set_color(edge_color)
axd['freq'].set_title('Frequency')
radio = RadioButtons(axd['freq'], labels=list(FREQUENCIES.keys()),
                     label_props={'fontsize': [12, 14, 16]},
                     radio_props={'s': [16, 32, 64]})


def update_frequency(label):
    ydata = f(t, freq=FREQUENCIES[label])
    line.set_ydata(ydata)
    fig.canvas.draw()
radio.on_clicked(update_frequency)


axd['color'].set_facecolor(background_color)
axd['color'].spines[:].set_color(edge_color)
axd['color'].set_title('Color')
radio2 = RadioButtons(
    axd['color'], ('red', 'blue', 'green'),
    label_props={'color': ['red', 'blue', 'green']},
    radio_props={
        'facecolor': ['red', 'blue', 'green'],
        'edgecolor': ['darkred', 'darkblue', 'darkgreen'],
    })


def update_color(label):
    line.set_color(label)
    fig.canvas.draw()
radio2.on_clicked(update_color)


axd['linestyle'].set_facecolor(background_color)
axd['linestyle'].spines[:].set_color(edge_color)
axd['linestyle'].set_title('Linestyle')
radio3 = RadioButtons(axd['linestyle'], ('solid', 'dashed', 'dashdot', 'dotted'))


def update_linestyle(label):
    line.set_linestyle(label)
    fig.canvas.draw()
radio3.on_clicked(update_linestyle)

plt.show()
References
The use of the following functions, methods, classes and modules is shown in this example: