Note
Go to the end to download the full example code.
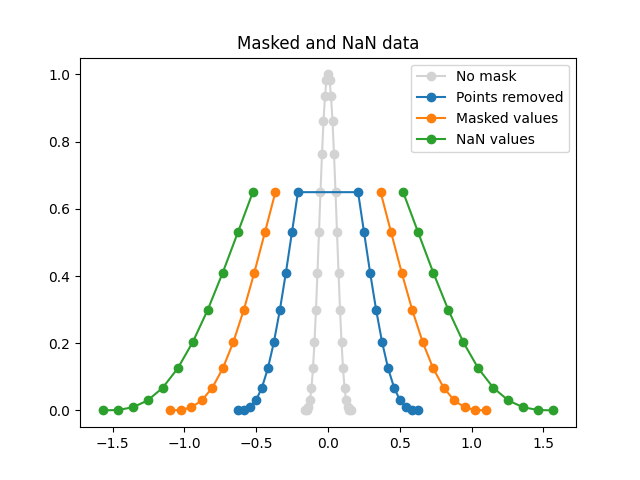
Plotting masked and NaN values#
Sometimes you need to plot data with missing values.
One possibility is to simply remove undesired data points. The line plotted through the remaining data will be continuous, and not indicate where the missing data is located.
If it is useful to have gaps in the line where the data is missing, then the undesired points can be indicated using a masked array or by setting their values to NaN. No marker will be drawn where either x or y are masked and, if plotting with a line, it will be broken there.
The following example illustrates the three cases:
Removing points.
Masking points.
Setting to NaN.
import matplotlib.pyplot as plt
import numpy as np

x = np.linspace(-np.pi/2, np.pi/2, 31)
y = np.cos(x)**3

# 1) remove points where y > 0.7
x2 = x[y <= 0.7]
y2 = y[y <= 0.7]

# 2) mask points where y > 0.7
y3 = np.ma.masked_where(y > 0.7, y)

# 3) set to NaN where y > 0.7
y4 = y.copy()
y4[y3 > 0.7] = np.nan

plt.plot(x*0.1, y, 'o-', color='lightgrey', label='No mask')
plt.plot(x2*0.4, y2, 'o-', label='Points removed')
plt.plot(x*0.7, y3, 'o-', label='Masked values')
plt.plot(x*1.0, y4, 'o-', label='NaN values')
plt.legend()
plt.title('Masked and NaN data')
plt.show()