Note
Go to the end to download the full example code.
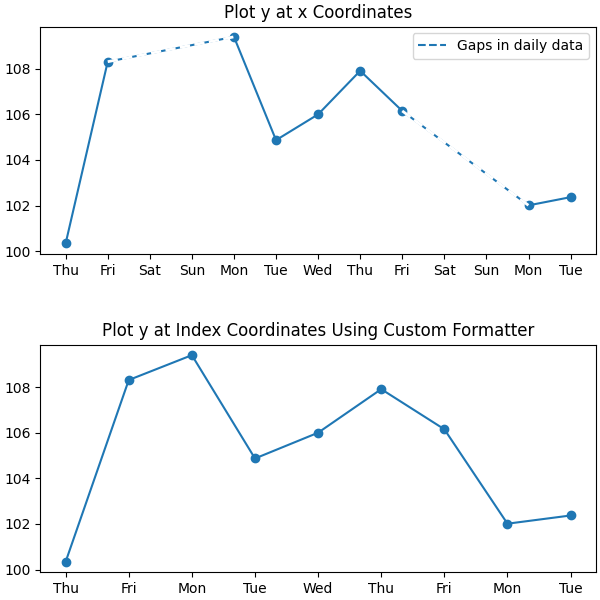
Custom tick formatter for time series#
When plotting daily data, e.g., financial time series, one often wants to leave out days on which there is no data, for instance weekends, so that the data are plotted at regular intervals without extra spaces for the days with no data. The example shows how to use an 'index formatter' to achieve the desired plot.
import matplotlib.pyplot as plt
import numpy as np

import matplotlib.cbook as cbook
from matplotlib.dates import DateFormatter, DayLocator
import matplotlib.lines as ml
from matplotlib.ticker import Formatter

# Load a structured numpy array from yahoo csv data with fields date, open, high,
# low, close, volume, adj_close from the mpl-data/sample_data directory. The
# record array stores the date as an np.datetime64 with a day unit ('D') in
# the date column (``r['date']``).
r = cbook.get_sample_data('goog.npz')['price_data']
r = r[:9]  # get the first 9 days

fig, (ax1, ax2) = plt.subplots(nrows=2, figsize=(6, 6), layout='constrained')
fig.get_layout_engine().set(hspace=0.15)

# First we'll do it the default way, with gaps on weekends
ax1.plot(r["date"], r["adj_close"], 'o-')

# Highlight gaps in daily data
gaps = np.flatnonzero(np.diff(r["date"]) > np.timedelta64(1, 'D'))
for gap in r[['date', 'adj_close']][np.stack((gaps, gaps + 1)).T]:
    ax1.plot(gap['date'], gap['adj_close'], 'w--', lw=2)
ax1.legend(handles=[ml.Line2D([], [], ls='--', label='Gaps in daily data')])

ax1.set_title("Plot y at x Coordinates")
ax1.xaxis.set_major_locator(DayLocator())
ax1.xaxis.set_major_formatter(DateFormatter('%a'))


# Next we'll write a custom index formatter. Below we will plot
# the data against an index that goes from 0, 1,  ... len(data).  Instead of
# formatting the tick marks as integers, we format as times.
def format_date(x, _):
    try:
        # convert datetime64 to datetime, and use datetime's strftime:
        return r["date"][round(x)].item().strftime('%a')
    except IndexError:
        pass

# Create an index plot (x defaults to range(len(y)) if omitted)
ax2.plot(r["adj_close"], 'o-')

ax2.set_title("Plot y at Index Coordinates Using Custom Formatter")
ax2.xaxis.set_major_formatter(format_date)  # internally creates FuncFormatter
Instead of passing a function into Axis.set_major_formatter you can use
any other callable, e.g. an instance of a class that implements __call__:
class MyFormatter(Formatter):
    def __init__(self, dates, fmt='%a'):
        self.dates = dates
        self.fmt = fmt

    def __call__(self, x, pos=0):
        """Return the label for time x at position pos."""
        try:
            return self.dates[round(x)].item().strftime(self.fmt)
        except IndexError:
            pass


ax2.xaxis.set_major_formatter(MyFormatter(r["date"], '%a'))

plt.show()