Note
Go to the end to download the full example code.
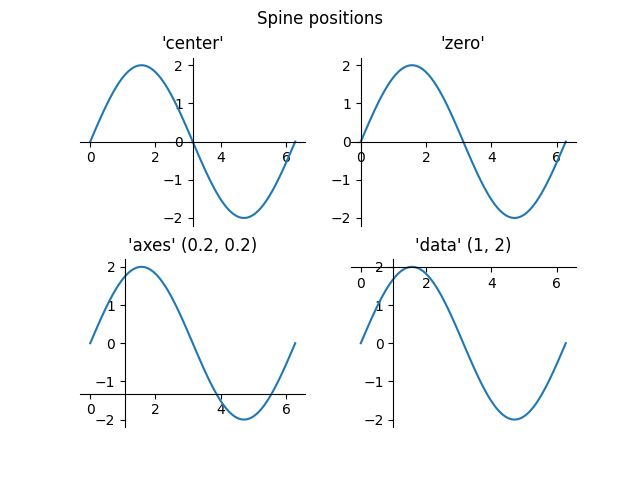
Spine placement#
The position of the axis spines can be influenced using set_position.
Note: If you want to obtain arrow heads at the ends of the axes, also check out the Centered spines with arrows example.
import matplotlib.pyplot as plt
import numpy as np
x = np.linspace(0, 2*np.pi, 100)
y = 2 * np.sin(x)

fig, ax_dict = plt.subplot_mosaic(
    [['center', 'zero'],
     ['axes', 'data']]
)
fig.suptitle('Spine positions')


ax = ax_dict['center']
ax.set_title("'center'")
ax.plot(x, y)
ax.spines[['left', 'bottom']].set_position('center')
ax.spines[['top', 'right']].set_visible(False)

ax = ax_dict['zero']
ax.set_title("'zero'")
ax.plot(x, y)
ax.spines[['left', 'bottom']].set_position('zero')
ax.spines[['top', 'right']].set_visible(False)

ax = ax_dict['axes']
ax.set_title("'axes' (0.2, 0.2)")
ax.plot(x, y)
ax.spines.left.set_position(('axes', 0.2))
ax.spines.bottom.set_position(('axes', 0.2))
ax.spines[['top', 'right']].set_visible(False)

ax = ax_dict['data']
ax.set_title("'data' (1, 2)")
ax.plot(x, y)
ax.spines.left.set_position(('data', 1))
ax.spines.bottom.set_position(('data', 2))
ax.spines[['top', 'right']].set_visible(False)

plt.show()