Note
Go to the end to download the full example code.
Colorbar Tick labelling#
Vertical colorbars have ticks, tick labels, and labels visible on the y axis,
horizontal colorbars on the x axis. The ticks parameter can be used to
set the ticks and the format parameter can be used to format the tick labels
of the visible colorbar Axes. For further adjustments, the yaxis or
xaxis Axes of the colorbar can be retrieved using its ax property.
import matplotlib.pyplot as plt
import numpy as np

import matplotlib.ticker as mticker

# Fixing random state for reproducibility
rng = np.random.default_rng(seed=19680801)
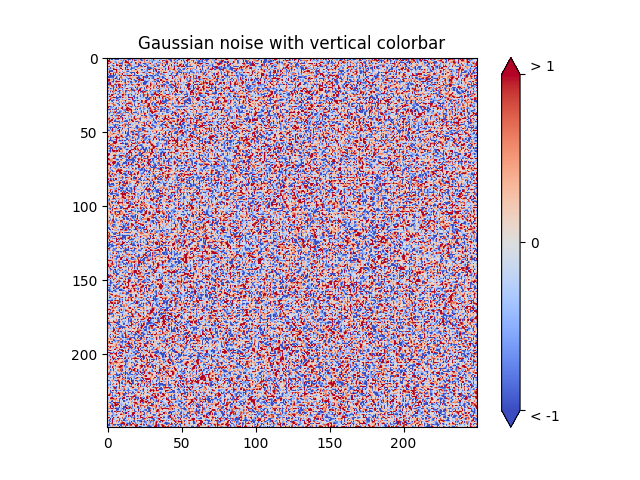
Make plot with vertical (default) colorbar
fig, ax = plt.subplots()

data = rng.standard_normal((250, 250))

cax = ax.imshow(data, vmin=-1, vmax=1, cmap='coolwarm')
ax.set_title('Gaussian noise with vertical colorbar')

# Add colorbar, make sure to specify tick locations to match desired ticklabels
cbar = fig.colorbar(cax,
                    ticks=[-1, 0, 1],
                    format=mticker.FixedFormatter(['< -1', '0', '> 1']),
                    extend='both'
                    )
labels = cbar.ax.get_yticklabels()
labels[0].set_verticalalignment('top')
labels[-1].set_verticalalignment('bottom')
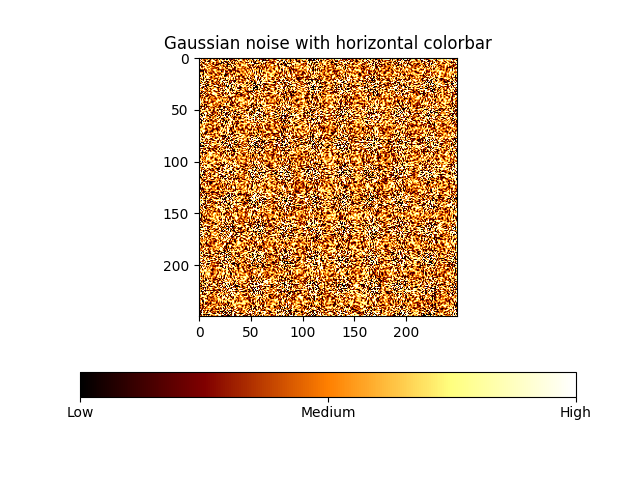
Make plot with horizontal colorbar
fig, ax = plt.subplots()

data = np.clip(data, -1, 1)

cax = ax.imshow(data, cmap='afmhot')
ax.set_title('Gaussian noise with horizontal colorbar')

# Add colorbar and adjust ticks afterwards
cbar = fig.colorbar(cax, orientation='horizontal')
cbar.set_ticks(ticks=[-1, 0, 1], labels=['Low', 'Medium', 'High'])

plt.show()
References
The use of the following functions, methods, classes and modules is shown in this example:
Total running time of the script: (0 minutes 1.087 seconds)