Note
Go to the end to download the full example code.
Create multiple subplots using plt.subplots#
pyplot.subplots creates a figure and a grid of subplots with a single call,
while providing reasonable control over how the individual plots are created.
For more advanced use cases you can use GridSpec for a more general subplot
layout or Figure.add_subplot for adding subplots at arbitrary locations
within the figure.
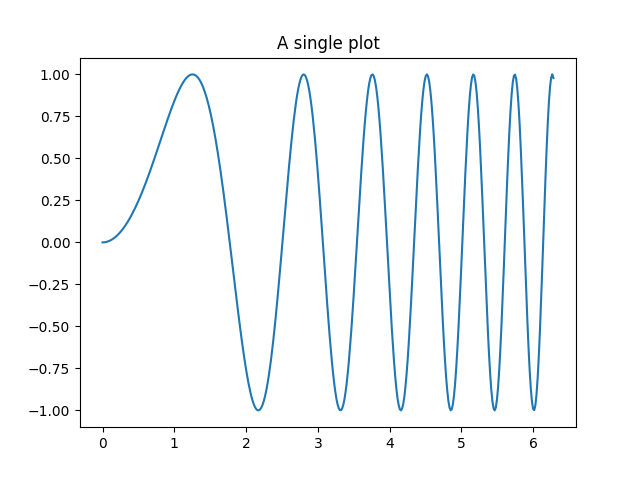
A figure with just one subplot#
subplots() without arguments returns a Figure and a single
Axes.
This is actually the simplest and recommended way of creating a single Figure and Axes.
fig, ax = plt.subplots()
ax.plot(x, y)
ax.set_title('A single plot')
Stacking subplots in one direction#
The first two optional arguments of pyplot.subplots define the number of
rows and columns of the subplot grid.
When stacking in one direction only, the returned axs is a 1D numpy array
containing the list of created Axes.
fig, axs = plt.subplots(2)
fig.suptitle('Vertically stacked subplots')
axs[0].plot(x, y)
axs[1].plot(x, -y)

If you are creating just a few Axes, it's handy to unpack them immediately to
dedicated variables for each Axes. That way, we can use ax1 instead of
the more verbose axs[0].
fig, (ax1, ax2) = plt.subplots(2)
fig.suptitle('Vertically stacked subplots')
ax1.plot(x, y)
ax2.plot(x, -y)

To obtain side-by-side subplots, pass parameters 1, 2 for one row and two
columns.
fig, (ax1, ax2) = plt.subplots(1, 2)
fig.suptitle('Horizontally stacked subplots')
ax1.plot(x, y)
ax2.plot(x, -y)

Stacking subplots in two directions#
When stacking in two directions, the returned axs is a 2D NumPy array.
If you have to set parameters for each subplot it's handy to iterate over
all subplots in a 2D grid using for ax in axs.flat:.
fig, axs = plt.subplots(2, 2)
axs[0, 0].plot(x, y)
axs[0, 0].set_title('Axis [0, 0]')
axs[0, 1].plot(x, y, 'tab:orange')
axs[0, 1].set_title('Axis [0, 1]')
axs[1, 0].plot(x, -y, 'tab:green')
axs[1, 0].set_title('Axis [1, 0]')
axs[1, 1].plot(x, -y, 'tab:red')
axs[1, 1].set_title('Axis [1, 1]')

for ax in axs.flat:
    ax.set(xlabel='x-label', ylabel='y-label')

# Hide x labels and tick labels for top plots and y ticks for right plots.
for ax in axs.flat:
    ax.label_outer()
![Axis [0, 0], Axis [0, 1], Axis [1, 0], Axis [1, 1]](../../_images/sphx_glr_subplots_demo_005.png)
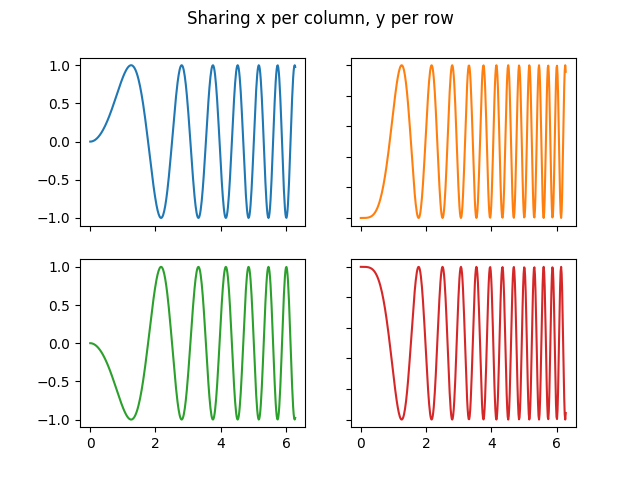
You can use tuple-unpacking also in 2D to assign all subplots to dedicated variables:
fig, ((ax1, ax2), (ax3, ax4)) = plt.subplots(2, 2)
fig.suptitle('Sharing x per column, y per row')
ax1.plot(x, y)
ax2.plot(x, y**2, 'tab:orange')
ax3.plot(x, -y, 'tab:green')
ax4.plot(x, -y**2, 'tab:red')

for ax in fig.get_axes():
    ax.label_outer()
Sharing axes#
By default, each Axes is scaled individually. Thus, if the ranges are different the tick values of the subplots do not align.
fig, (ax1, ax2) = plt.subplots(2)
fig.suptitle('Axes values are scaled individually by default')
ax1.plot(x, y)
ax2.plot(x + 1, -y)

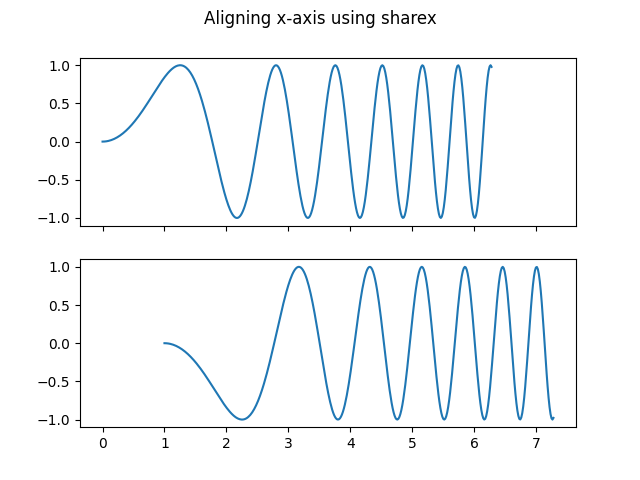
You can use sharex or sharey to align the horizontal or vertical axis.
fig, (ax1, ax2) = plt.subplots(2, sharex=True)
fig.suptitle('Aligning x-axis using sharex')
ax1.plot(x, y)
ax2.plot(x + 1, -y)
Setting sharex or sharey to True enables global sharing across the
whole grid, i.e. also the y-axes of vertically stacked subplots have the
same scale when using sharey=True.

For subplots that are sharing axes one set of tick labels is enough. Tick
labels of inner Axes are automatically removed by sharex and sharey.
You can selectively restore them using tick_params.

It is also possible to remove the empty space between the subplots.
To precisely control the positioning of the subplots, one can explicitly
create a GridSpec with Figure.add_gridspec, and then call its
subplots method. For example, we can reduce the height
between vertical subplots using add_gridspec(hspace=0).
label_outer is a handy method to remove labels and ticks from subplots
that are not at the edge of the grid.
fig = plt.figure()
gs = fig.add_gridspec(3, hspace=0)
axs = gs.subplots(sharex=True, sharey=True)
fig.suptitle('Sharing both axes')
axs[0].plot(x, y ** 2)
axs[1].plot(x, 0.3 * y, 'o')
axs[2].plot(x, y, '+')

# Hide x labels and tick labels for all but bottom plot.
for ax in axs:
    ax.label_outer()

Apart from True and False, both sharex and sharey accept the
values 'row' and 'col' to share the values only per row or column.
fig = plt.figure()
gs = fig.add_gridspec(2, 2, hspace=0, wspace=0)
(ax1, ax2), (ax3, ax4) = gs.subplots(sharex='col', sharey='row')
fig.suptitle('Sharing x per column, y per row')
ax1.plot(x, y)
ax2.plot(x, y**2, 'tab:orange')
ax3.plot(x + 1, -y, 'tab:green')
ax4.plot(x + 2, -y**2, 'tab:red')

for ax in fig.get_axes():
    ax.label_outer()

If you want a more complex sharing structure, you can first create the
grid of Axes with no sharing, and then call axes.Axes.sharex or
axes.Axes.sharey to add sharing info a posteriori.
fig, axs = plt.subplots(2, 2)
axs[0, 0].plot(x, y)
axs[0, 0].set_title("main")
axs[1, 0].plot(x, y**2)
axs[1, 0].set_title("shares x with main")
axs[1, 0].sharex(axs[0, 0])
axs[0, 1].plot(x + 1, y + 1)
axs[0, 1].set_title("unrelated")
axs[1, 1].plot(x + 2, y + 2)
axs[1, 1].set_title("also unrelated")
fig.tight_layout()
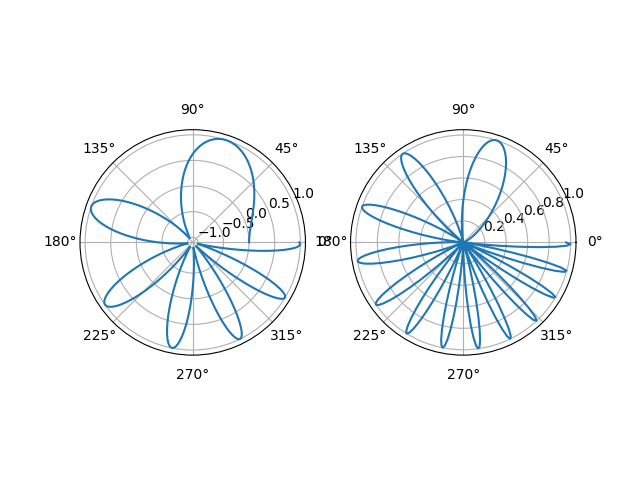
Polar Axes#
The parameter subplot_kw of pyplot.subplots controls the subplot
properties (see also Figure.add_subplot). In particular, this can be used
to create a grid of polar Axes.

Total running time of the script: (0 minutes 7.383 seconds)