Note
Go to the end to download the full example code.
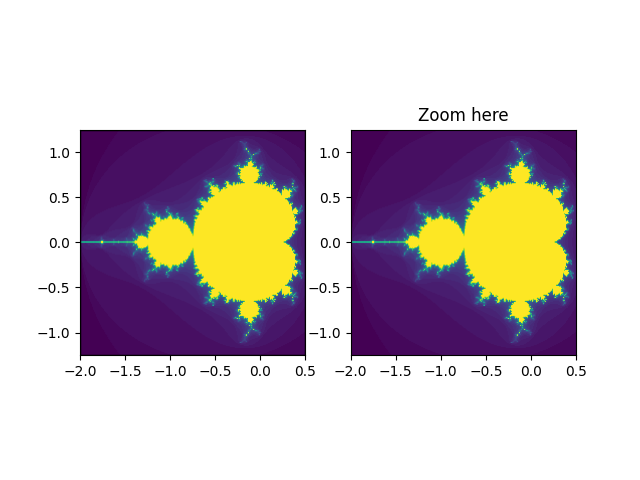
Viewlims#
Creates two identical panels. Zooming in on the right panel will show a rectangle in the first panel, denoting the zoomed region.
Note
This example exercises the interactive capabilities of Matplotlib, and this will not appear in the static documentation. Please run this code on your machine to see the interactivity.
You can copy and paste individual parts, or download the entire example using the link at the bottom of the page.
import functools

import matplotlib.pyplot as plt
import numpy as np

from matplotlib.patches import Rectangle


# A class that will regenerate a fractal set as we zoom in, so that you
# can actually see the increasing detail.  A box in the left panel will show
# the area to which we are zoomed.
class MandelbrotDisplay:
    def __init__(self, h=500, w=500, niter=50, radius=2., power=2):
        self.height = h
        self.width = w
        self.niter = niter
        self.radius = radius
        self.power = power

    def compute_image(self, xlim, ylim):
        self.x = np.linspace(*xlim, self.width)
        self.y = np.linspace(*ylim, self.height).reshape(-1, 1)
        c = self.x + 1.0j * self.y
        threshold_time = np.zeros((self.height, self.width))
        z = np.zeros(threshold_time.shape, dtype=complex)
        mask = np.ones(threshold_time.shape, dtype=bool)
        for i in range(self.niter):
            z[mask] = z[mask]**self.power + c[mask]
            mask = (np.abs(z) < self.radius)
            threshold_time += mask
        return threshold_time

    def ax_update(self, ax):
        ax.set_autoscale_on(False)  # Otherwise, infinite loop
        # Get the number of points from the number of pixels in the window
        self.width, self.height = ax.patch.get_window_extent().size.round().astype(int)
        # Update the image object with our new data and extent
        ax.images[-1].set(data=self.compute_image(ax.get_xlim(), ax.get_ylim()),
                          extent=(*ax.get_xlim(), *ax.get_ylim()))
        ax.figure.canvas.draw_idle()


md = MandelbrotDisplay()

fig1, (ax_full, ax_zoom) = plt.subplots(1, 2)
ax_zoom.imshow([[0]], origin="lower")  # Empty initial image.
ax_zoom.set_title("Zoom here")

rect = Rectangle(
    [0, 0], 0, 0, facecolor="none", edgecolor="black", linewidth=1.0)
ax_full.add_patch(rect)


def update_rect(rect, ax):  # Let the rectangle track the bounds of the zoom axes.
    xlo, xhi = ax.get_xlim()
    ylo, yhi = ax.get_ylim()
    rect.set_bounds((xlo, ylo, xhi - xlo, yhi - ylo))
    ax.figure.canvas.draw_idle()


# Connect for changing the view limits.
ax_zoom.callbacks.connect("xlim_changed", functools.partial(update_rect, rect))
ax_zoom.callbacks.connect("ylim_changed", functools.partial(update_rect, rect))

ax_zoom.callbacks.connect("xlim_changed", md.ax_update)
ax_zoom.callbacks.connect("ylim_changed", md.ax_update)

# Initialize: trigger image computation by setting view limits; set colormap limits;
# copy image to full view.
ax_zoom.set(xlim=(-2, .5), ylim=(-1.25, 1.25))
im = ax_zoom.images[0]
ax_zoom.images[0].set(clim=(im.get_array().min(), im.get_array().max()))
ax_full.imshow(im.get_array(), extent=im.get_extent(), origin="lower")

plt.show()