Note
Go to the end to download the full example code.
3D stem#
Demonstration of a stem plot in 3D, which plots vertical lines from a baseline to the z-coordinate and places a marker at the tip.
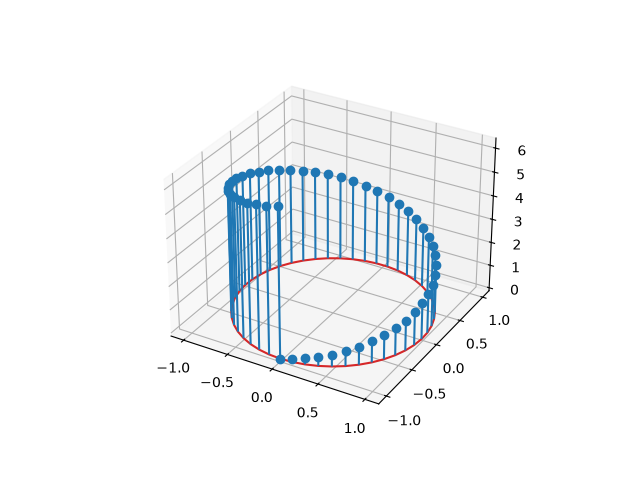
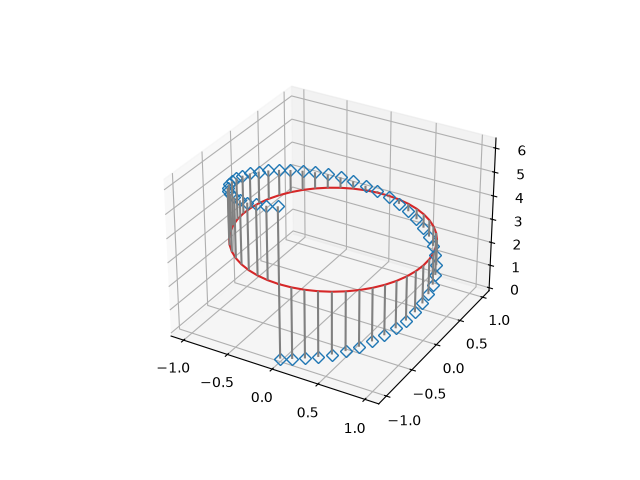
The position of the baseline can be adapted using bottom. The parameters
linefmt, markerfmt, and basefmt control basic format properties of the
plot. However, in contrast to plot not all properties are
configurable via keyword arguments. For more advanced control adapt the line
objects returned by stem.
fig, ax = plt.subplots(subplot_kw=dict(projection='3d'))
markerline, stemlines, baseline = ax.stem(
    x, y, z, linefmt='grey', markerfmt='D', bottom=np.pi)
markerline.set_markerfacecolor('none')

plt.show()
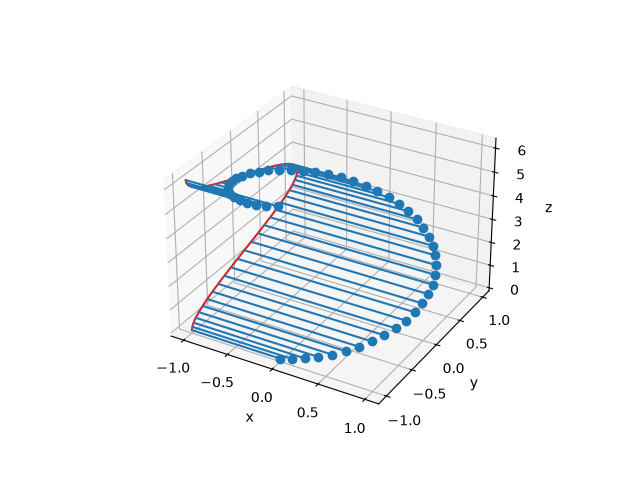
The orientation of the stems and baseline can be changed using orientation. This determines in which direction the stems are projected from the head points, towards the bottom baseline.
For examples, by setting orientation='x', the stems are projected along
the x-direction, and the baseline is in the yz-plane.
Total running time of the script: (0 minutes 1.772 seconds)