Note
Go to the end to download the full example code.
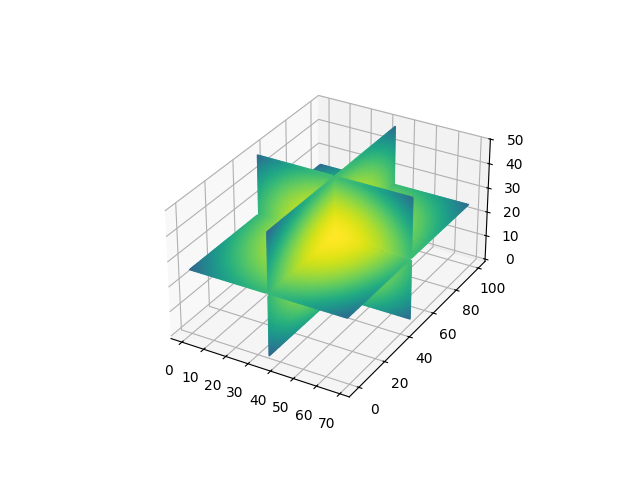
Intersecting planes#
This examples demonstrates drawing intersecting planes in 3D. It is a generalization of 2D images in 3D.
Drawing intersecting planes in mplot3d is complicated, because mplot3d is not a
real 3D renderer, but only projects the Artists into 3D and draws them in the right
order. This does not work correctly if Artists overlap each other mutually. In this
example, we lift the problem of mutual overlap by segmenting the planes at their
intersections, making four parts out of each plane.
This examples only works correctly for planes that cut each other in halves. This limitation is intentional to keep the code more readable. Cutting at arbitrary positions would of course be possible but makes the code even more complex. Thus, this example is more a demonstration of the concept how to work around limitations of the 3D visualization, it's not a refined solution for drawing arbitrary intersecting planes, which you can copy-and-paste as is.
import matplotlib.pyplot as plt
import numpy as np


def plot_quadrants(ax, array, fixed_coord, cmap):
    """For a given 3d *array* plot a plane with *fixed_coord*, using four quadrants."""
    nx, ny, nz = array.shape
    index = {
        'x': (nx // 2, slice(None), slice(None)),
        'y': (slice(None), ny // 2, slice(None)),
        'z': (slice(None), slice(None), nz // 2),
    }[fixed_coord]
    plane_data = array[index]

    n0, n1 = plane_data.shape
    quadrants = [
        plane_data[:n0 // 2, :n1 // 2],
        plane_data[:n0 // 2, n1 // 2:],
        plane_data[n0 // 2:, :n1 // 2],
        plane_data[n0 // 2:, n1 // 2:]
    ]

    min_val = array.min()
    max_val = array.max()

    cmap = plt.get_cmap(cmap)

    for i, quadrant in enumerate(quadrants):
        facecolors = cmap((quadrant - min_val) / (max_val - min_val))
        if fixed_coord == 'x':
            Y, Z = np.mgrid[0:ny // 2, 0:nz // 2]
            X = nx // 2 * np.ones_like(Y)
            Y_offset = (i // 2) * ny // 2
            Z_offset = (i % 2) * nz // 2
            ax.plot_surface(X, Y + Y_offset, Z + Z_offset, rstride=1, cstride=1,
                            facecolors=facecolors, shade=False)
        elif fixed_coord == 'y':
            X, Z = np.mgrid[0:nx // 2, 0:nz // 2]
            Y = ny // 2 * np.ones_like(X)
            X_offset = (i // 2) * nx // 2
            Z_offset = (i % 2) * nz // 2
            ax.plot_surface(X + X_offset, Y, Z + Z_offset, rstride=1, cstride=1,
                            facecolors=facecolors, shade=False)
        elif fixed_coord == 'z':
            X, Y = np.mgrid[0:nx // 2, 0:ny // 2]
            Z = nz // 2 * np.ones_like(X)
            X_offset = (i // 2) * nx // 2
            Y_offset = (i % 2) * ny // 2
            ax.plot_surface(X + X_offset, Y + Y_offset, Z, rstride=1, cstride=1,
                            facecolors=facecolors, shade=False)


def figure_3D_array_slices(array, cmap=None):
    """Plot a 3d array using three intersecting centered planes."""
    fig = plt.figure()
    ax = fig.add_subplot(projection='3d')
    ax.set_box_aspect(array.shape)
    plot_quadrants(ax, array, 'x', cmap=cmap)
    plot_quadrants(ax, array, 'y', cmap=cmap)
    plot_quadrants(ax, array, 'z', cmap=cmap)
    return fig, ax


nx, ny, nz = 70, 100, 50
r_square = (np.mgrid[-1:1:1j * nx, -1:1:1j * ny, -1:1:1j * nz] ** 2).sum(0)

figure_3D_array_slices(r_square, cmap='viridis_r')
plt.show()
Total running time of the script: (0 minutes 2.604 seconds)