Note
Go to the end to download the full example code.
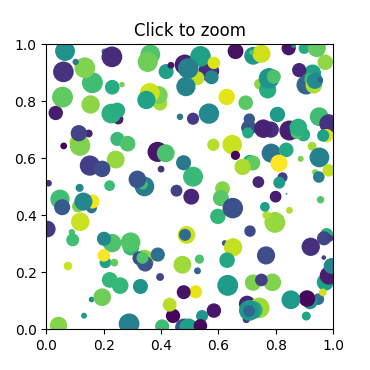
Zoom modifies other Axes#
This example shows how to connect events in one window, for example, a mouse press, to another figure window.
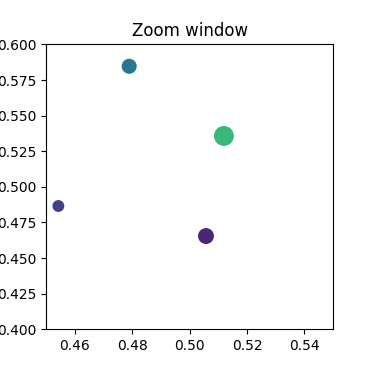
If you click on a point in the first window, the z and y limits of the second will be adjusted so that the center of the zoom in the second window will be the (x, y) coordinates of the clicked point.
Note the diameter of the circles in the scatter are defined in points**2, so their size is independent of the zoom.
Note
This example exercises the interactive capabilities of Matplotlib, and this will not appear in the static documentation. Please run this code on your machine to see the interactivity.
You can copy and paste individual parts, or download the entire example using the link at the bottom of the page.
import matplotlib.pyplot as plt
import numpy as np

# Fixing random state for reproducibility
np.random.seed(19680801)

figsrc, axsrc = plt.subplots(figsize=(3.7, 3.7))
figzoom, axzoom = plt.subplots(figsize=(3.7, 3.7))
axsrc.set(xlim=(0, 1), ylim=(0, 1), autoscale_on=False,
          title='Click to zoom')
axzoom.set(xlim=(0.45, 0.55), ylim=(0.4, 0.6), autoscale_on=False,
           title='Zoom window')

x, y, s, c = np.random.rand(4, 200)
s *= 200

axsrc.scatter(x, y, s, c)
axzoom.scatter(x, y, s, c)


def on_press(event):
    if event.button != 1:
        return
    x, y = event.xdata, event.ydata
    axzoom.set_xlim(x - 0.1, x + 0.1)
    axzoom.set_ylim(y - 0.1, y + 0.1)
    figzoom.canvas.draw()

figsrc.canvas.mpl_connect('button_press_event', on_press)
plt.show()