Note
Go to the end to download the full example code.
Contourf hatching#
Demo filled contour plots with hatched patterns.
import matplotlib.pyplot as plt
import numpy as np

# invent some numbers, turning the x and y arrays into simple
# 2d arrays, which make combining them together easier.
x = np.linspace(-3, 5, 150).reshape(1, -1)
y = np.linspace(-3, 5, 120).reshape(-1, 1)
z = np.cos(x) + np.sin(y)

# we no longer need x and y to be 2 dimensional, so flatten them.
x, y = x.flatten(), y.flatten()
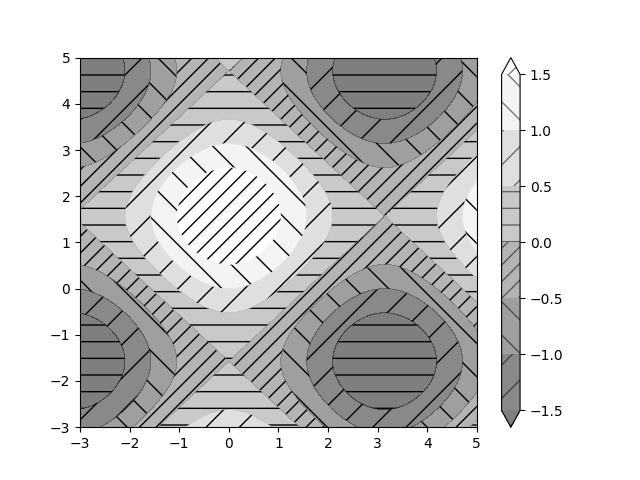
Plot 1: the simplest hatched plot with a colorbar
fig1, ax1 = plt.subplots()
cs = ax1.contourf(x, y, z, hatches=['-', '/', '\\', '//'],
                  cmap='gray', extend='both', alpha=0.5)
fig1.colorbar(cs)
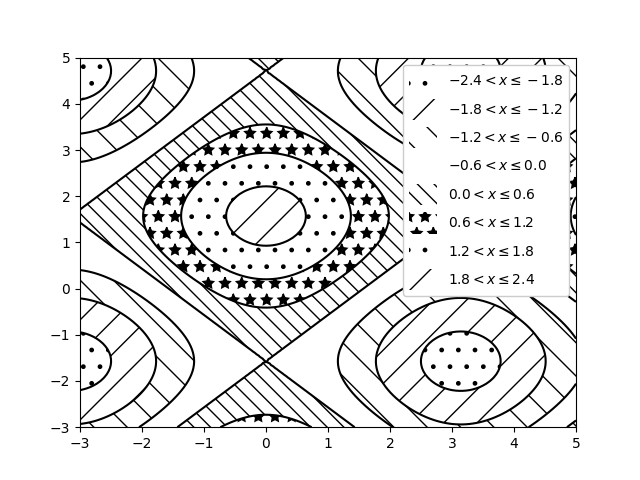
Plot 2: a plot of hatches without color with a legend
fig2, ax2 = plt.subplots()
n_levels = 6
ax2.contour(x, y, z, n_levels, colors='black', linestyles='-')
cs = ax2.contourf(x, y, z, n_levels, colors='none',
                  hatches=['.', '/', '\\', None, '\\\\', '*'],
                  extend='lower')

# create a legend for the contour set
artists, labels = cs.legend_elements(str_format='{:2.1f}'.format)
ax2.legend(artists, labels, handleheight=2, framealpha=1)
plt.show()
References
The use of the following functions, methods, classes and modules is shown in this example: