Note
Go to the end to download the full example code.
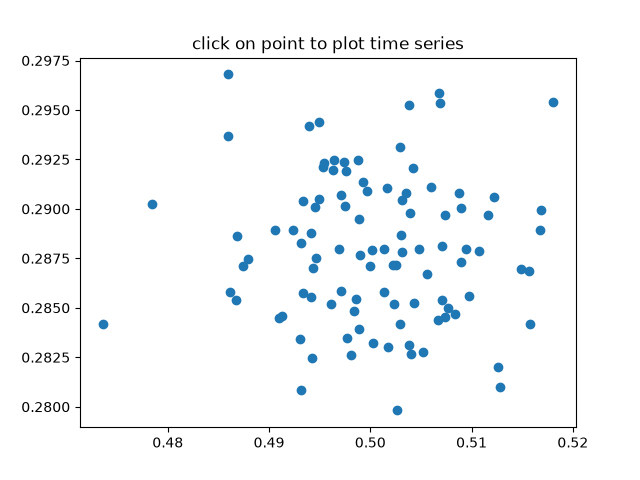
Pick event demo 2#
Compute the mean (mu) and standard deviation (sigma) of 100 data sets and plot mu vs. sigma. When you click on one of the (mu, sigma) points, plot the raw data from the dataset that generated this point.
Note
This example exercises the interactive capabilities of Matplotlib, and this will not appear in the static documentation. Please run this code on your machine to see the interactivity.
You can copy and paste individual parts, or download the entire example using the link at the bottom of the page.
import matplotlib.pyplot as plt
import numpy as np

# Fixing random state for reproducibility
np.random.seed(19680801)

X = np.random.rand(100, 1000)
xs = np.mean(X, axis=1)
ys = np.std(X, axis=1)

fig, ax = plt.subplots()
ax.set_title('click on point to plot time series')
line, = ax.plot(xs, ys, 'o', picker=True, pickradius=5)


def onpick(event):

    if event.artist != line:
        return

    N = len(event.ind)
    if not N:
        return

    figi, axs = plt.subplots(N, squeeze=False)
    for ax, dataind in zip(axs.flat, event.ind):
        ax.plot(X[dataind])
        ax.text(.05, .9, f'mu={xs[dataind]:1.3f}\nsigma={ys[dataind]:1.3f}',
                transform=ax.transAxes, va='top')
        ax.set_ylim(-0.5, 1.5)
    figi.show()


fig.canvas.mpl_connect('pick_event', onpick)

plt.show()