matplotlib.axes.Axes.text#
- Axes.text(x, y, s, fontdict=None, **kwargs)[source]#
Add text to the Axes.
Add the text s to the Axes at location x, y in data coordinates, with a default
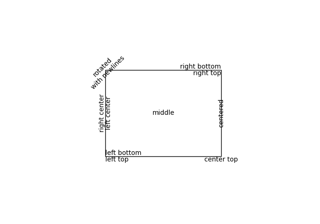
horizontalalignmenton theleftandverticalalignmentat thebaseline. See Text alignment.- Parameters:
- x, yfloat
The position to place the text. By default, this is in data coordinates. The coordinate system can be changed using the transform parameter.
- sstr
The text.
- fontdictdict, default: None
Discouraged
The use of fontdict is discouraged. Parameters should be passed as individual keyword arguments or using dictionary-unpacking
text(..., **fontdict).A dictionary to override the default text properties. If fontdict is None, the defaults are determined by
rcParams.
- Returns:
- Other Parameters:
- **kwargs
Textproperties. Other miscellaneous text parameters.
Property
Description
a filter function, which takes a (m, n, 3) float array and a dpi value, and returns a (m, n, 3) array and two offsets from the bottom left corner of the image
float or None
bool
bool
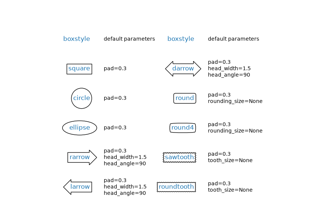
dict with properties for
FancyBboxPatchor Noneunknown
unknown
unknown
fontfamilyorfamilyorfontname{FONTNAME, 'serif', 'sans-serif', 'cursive', 'fantasy', 'monospace'}
list of str, or tuple of str, or None
float or {'xx-small', 'x-small', 'small', 'medium', 'large', 'x-large', 'xx-large'}
{a numeric value in range 0-1000, 'ultra-condensed', 'extra-condensed', 'condensed', 'semi-condensed', 'normal', 'semi-expanded', 'expanded', 'extra-expanded', 'ultra-expanded'}
{'normal', 'italic', 'oblique'}
{'normal', 'small-caps'}
fontweightorweight{a numeric value in range 0-1000, 'ultralight', 'light', 'normal', 'regular', 'book', 'medium', 'roman', 'semibold', 'demibold', 'demi', 'bold', 'heavy', 'extra bold', 'black'}
str
{'left', 'center', 'right'}
bool
object
str or None
'normal' or float, default: 'normal'
str
bool
multialignmentorma{'left', 'right', 'center'}
bool
list of
AbstractPathEffectNone or bool or float or callable
(float, float)
bool
float or {'vertical', 'horizontal'}
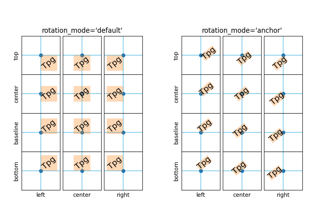
{None, 'default', 'anchor', 'xtick', 'ytick'}
(scale: float, length: float, randomness: float)
bool or None
object
bool
str
bool, default:
rcParams["text.usetex"](default:False){'baseline', 'bottom', 'center', 'center_baseline', 'top'}
bool
bool
float
float
float
- **kwargs
Examples
Individual keyword arguments can be used to override any given parameter:
>>> text(x, y, s, fontsize=12)
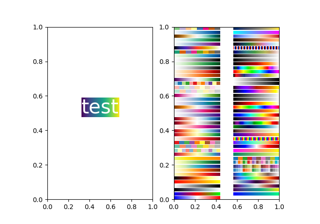
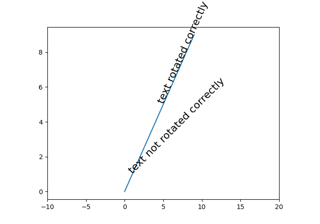
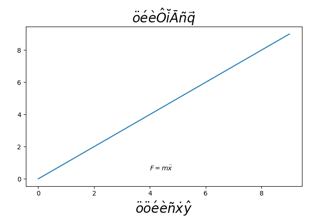
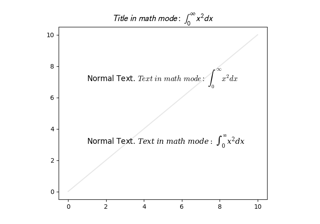
The default transform specifies that text is in data coords, alternatively, you can specify text in axis coords ((0, 0) is lower-left and (1, 1) is upper-right). The example below places text in the center of the Axes:
>>> text(0.5, 0.5, 'matplotlib', horizontalalignment='center',
...      verticalalignment='center', transform=ax.transAxes)
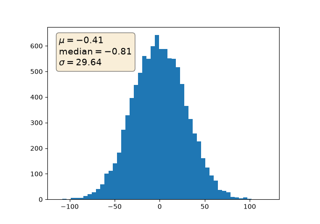
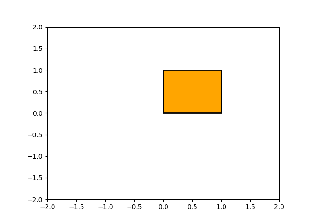
You can put a rectangular box around the text instance (e.g., to set a background color) by using the keyword bbox. bbox is a dictionary of
Rectangleproperties. For example:>>> text(x, y, s, bbox=dict(facecolor='red', alpha=0.5))
Examples using matplotlib.axes.Axes.text#


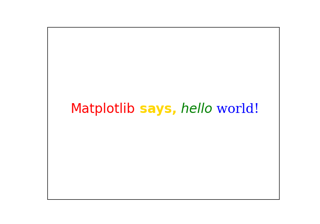
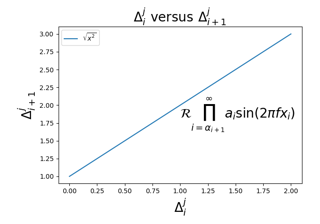
Concatenate text objects with different properties
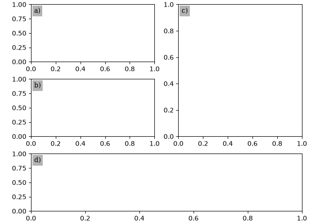


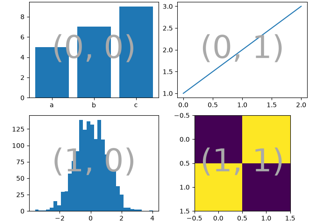
Complex and semantic figure composition (subplot_mosaic)