matplotlib.axes.Axes.errorbar#
- Axes.errorbar(x, y, yerr=None, xerr=None, fmt='', *, ecolor=None, elinewidth=None, capsize=None, barsabove=False, lolims=False, uplims=False, xlolims=False, xuplims=False, errorevery=1, capthick=None, elinestyle=None, data=None, **kwargs)[source]#
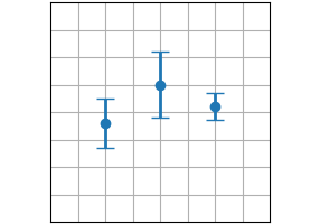
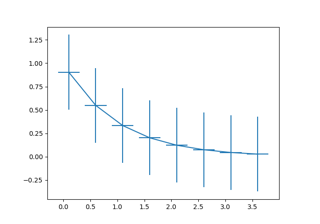
Plot y versus x as lines and/or markers with attached errorbars.
x, y define the data locations, xerr, yerr define the errorbar sizes. By default, this draws the data markers/lines as well as the errorbars. Use fmt='none' to draw errorbars without any data markers.
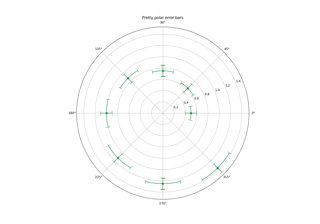
Added in version 3.7: Caps and error lines are drawn in polar coordinates on polar plots.
- Parameters:
- x, yfloat or array-like
The data positions.
- xerr, yerrfloat or array-like, shape(N,) or shape(2, N), optional
The errorbar sizes:
scalar: Symmetric +/- values for all data points.
shape(N,): Symmetric +/-values for each data point.
shape(2, N): Separate - and + values for each bar. First row contains the lower errors, the second row contains the upper errors.
None: No errorbar.
All values must be >= 0.
See Different ways of specifying error bars for an example on the usage of
xerrandyerr.- fmtstr, default: ''
The format for the data points / data lines. See
plotfor details.Use 'none' (case-insensitive) to plot errorbars without any data markers.
- ecolorcolor, default: None
The color of the errorbar lines. If None, use the color of the line connecting the markers.
- elinewidthfloat, default: None
The linewidth of the errorbar lines. If None, the linewidth of the current style is used.
- elinestylestr or tuple, default: 'solid'
The linestyle of the errorbar lines. Valid values for linestyles include {'-', '--', '-.',
':', '', (offset, on-off-seq)}. See
Line2D.set_linestylefor a complete description.- capsizefloat, default:
rcParams["errorbar.capsize"](default:0.0) The length of the error bar caps in points.
- capthickfloat, default: None
An alias to the keyword argument markeredgewidth (a.k.a. mew). This setting is a more sensible name for the property that controls the thickness of the error bar cap in points. For backwards compatibility, if mew or markeredgewidth are given, then they will over-ride capthick. This may change in future releases.
- barsabovebool, default: False
If True, will plot the errorbars above the plot symbols. Default is below.
- lolims, uplims, xlolims, xuplimsbool or array-like, default: False
These arguments can be used to indicate that a value gives only upper/lower limits. In that case a caret symbol is used to indicate this. lims-arguments may be scalars, or array-likes of the same length as xerr and yerr. To use limits with inverted axes,
set_xlimorset_ylimmust be called beforeerrorbar(). Note the tricky parameter names: setting e.g. lolims to True means that the y-value is a lower limit of the True value, so, only an upward-pointing arrow will be drawn!- erroreveryint or (int, int), default: 1
draws error bars on a subset of the data. errorevery =N draws error bars on the points (x[::N], y[::N]). errorevery =(start, N) draws error bars on the points (x[start::N], y[start::N]). e.g. errorevery=(6, 3) adds error bars to the data at (x[6], x[9], x[12], x[15], ...). Used to avoid overlapping error bars when two series share x-axis values.
- Returns:
ErrorbarContainerThe container contains:
data_line : A
Line2Dinstance of x, y plot markers and/or line.caplines : A tuple of
Line2Dinstances of the error bar caps.barlinecols : A tuple of
LineCollectionwith the horizontal and vertical error ranges.
- Other Parameters:
- dataindexable object, optional
If given, the following parameters also accept a string
s, which is interpreted asdata[s]ifsis a key indata:x, y, xerr, yerr
- **kwargs
All other keyword arguments are passed on to the
plotcall drawing the markers. For example, this code makes big red squares with thick green edges:x, y, yerr = rand(3, 10) errorbar(x, y, yerr, marker='s', mfc='red', mec='green', ms=20, mew=4)
where mfc, mec, ms and mew are aliases for the longer property names, markerfacecolor, markeredgecolor, markersize and markeredgewidth.
Valid kwargs for the marker properties are:
dashes
dash_capstyle
dash_joinstyle
drawstyle
fillstyle
linestyle
marker
markeredgecolor
markeredgewidth
markerfacecolor
markerfacecoloralt
markersize
markevery
solid_capstyle
solid_joinstyle
Refer to the corresponding
Line2Dproperty for more details:Property
Description
a filter function, which takes a (m, n, 3) float array and a dpi value, and returns a (m, n, 3) array and two offsets from the bottom left corner of the image
float or None
bool
antialiasedoraabool
BboxBaseor Nonebool
Patch or (Path, Transform) or None
CapStyleor {'butt', 'projecting', 'round'}JoinStyleor {'miter', 'round', 'bevel'}sequence of floats (on/off ink in points) or (None, None)
(2, N) array or two 1D arrays
{'default', 'steps', 'steps-pre', 'steps-mid', 'steps-post'}, default: 'default'
{'full', 'left', 'right', 'bottom', 'top', 'none'}
color or None
str
bool
object
{'-', '--', '-.', ':', '', ...} or (offset, on-off-seq)
float
marker style string,
PathorMarkerStylefloat
markersizeormsfloat
None or int or (int, int) or slice or list[int] or float or (float, float) or list[bool]
bool
list of
AbstractPathEffectfloat or callable[[Artist, Event], tuple[bool, dict]]
float
bool
(scale: float, length: float, randomness: float)
bool or None
CapStyleor {'butt', 'projecting', 'round'}JoinStyleor {'miter', 'round', 'bevel'}unknown
str
bool
1D array
1D array
float
Examples using matplotlib.axes.Axes.errorbar#


Create boxes from error bars using PatchCollection