matplotlib.axes.Axes.pcolormesh#
- Axes.pcolormesh(*args, alpha=None, norm=None, cmap=None, vmin=None, vmax=None, colorizer=None, shading=None, antialiased=False, data=None, **kwargs)[source]#
Create a pseudocolor plot with a non-regular rectangular grid.
Call signature:
pcolormesh([X, Y,] C, /, **kwargs)
X and Y can be used to specify the corners of the quadrilaterals.
The arguments X, Y, C are positional-only.
Hint
pcolormeshis similar topcolor. It is much faster and preferred in most cases. For a detailed discussion on the differences see Differences between pcolor() and pcolormesh().- Parameters:
- Carray-like
The mesh data. Supported array shapes are:
(M, N) or M*N: a mesh with scalar data. The values are mapped to colors using normalization and a colormap. See parameters norm, cmap, vmin, vmax.
(M, N, 3): an image with RGB values (0-1 float or 0-255 int).
(M, N, 4): an image with RGBA values (0-1 float or 0-255 int), i.e. including transparency.
The first two dimensions (M, N) define the rows and columns of the mesh data.
- X, Yarray-like, optional
The coordinates of the corners of quadrilaterals of a pcolormesh:
(X[i+1, j], Y[i+1, j])       (X[i+1, j+1], Y[i+1, j+1])
                      ●╶───╴●
                      │     │
                      ●╶───╴●
    (X[i, j], Y[i, j])       (X[i, j+1], Y[i, j+1])
Note that the column index corresponds to the x-coordinate, and the row index corresponds to y. For details, see the Notes section below.
If
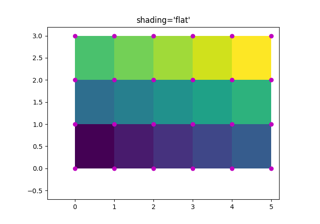
shading='flat'the dimensions of X and Y should be one greater than those of C, otherwise a TypeError is raised. The quadrilateral is colored due to the value atC[i, j].If
shading='nearest'or'gouraud', the dimensions of X and Y should be the same as those of C (if not, a TypeError will be raised). For'nearest'the colorC[i, j]is centered on(X[i, j], Y[i, j]). For'gouraud', a smooth interpolation is carried out between the quadrilateral corners.If X and/or Y are 1-D arrays or column vectors they will be expanded as needed into the appropriate 2D arrays, making a rectangular grid.
- cmapstr or
Colormap, default:rcParams["image.cmap"](default:'viridis') The Colormap instance or registered colormap name used to map scalar data to colors.
- normstr or
Normalize, optional The normalization method used to scale scalar data to the [0, 1] range before mapping to colors using cmap. By default, a linear scaling is used, mapping the lowest value to 0 and the highest to 1.
If given, this can be one of the following:
An instance of
Normalizeor one of its subclasses (see Colormap normalization).A scale name, i.e. one of "linear", "log", "symlog", "logit", etc. For a list of available scales, call
matplotlib.scale.get_scale_names(). In that case, a suitableNormalizesubclass is dynamically generated and instantiated.
- vmin, vmaxfloat, optional
When using scalar data and no explicit norm, vmin and vmax define the data range that the colormap covers. By default, the colormap covers the complete value range of the supplied data. It is an error to use vmin/vmax when a norm instance is given (but using a
strnorm name together with vmin/vmax is acceptable).- colorizer
Colorizeror None, default: None The Colorizer object used to map color to data. If None, a Colorizer object is created from a norm and cmap.
- edgecolors{'none', None, 'face', color, color sequence}, optional
The color of the edges. Defaults to 'none'. Possible values:
'none' or '': No edge.
None:
rcParams["patch.edgecolor"](default:'black') will be used. Note that currentlyrcParams["patch.force_edgecolor"](default:False) has to be True for this to work.'face': Use the adjacent face color.
A color or sequence of colors will set the edge color.
The singular form edgecolor works as an alias.
- alphafloat, default: None
The alpha blending value, between 0 (transparent) and 1 (opaque).
- shading{'flat', 'nearest', 'gouraud', 'auto'}, optional
The fill style for the quadrilateral; defaults to
rcParams["pcolor.shading"](default:'auto'). Possible values:'flat': A solid color is used for each quad. The color of the quad (i, j), (i+1, j), (i, j+1), (i+1, j+1) is given by
C[i, j]. The dimensions of X and Y should be one greater than those of C.'nearest': Each grid point will have a color centered on it, extending halfway between the adjacent grid centers. The dimensions of X and Y must be the same as C.
'gouraud': Each quad will be Gouraud shaded: The color of the corners (i', j') are given by
C[i', j']. The color values of the area in between is interpolated from the corner values. The dimensions of X and Y must be the same as C. When Gouraud shading is used, edgecolors is ignored.'auto': Choose 'flat' if dimensions of X and Y are one larger than C. Choose 'nearest' if dimensions are the same.
See pcolormesh grids and shading for more description.
- snapbool, default:
rcParams["pcolormesh.snap"](default:True) Whether to snap the mesh to pixel boundaries.
Changed in version 3.4.0: The default value changed from False to True to improve transparency handling. See What's new in Matplotlib 3.4.0 (Mar 26, 2021) for details.
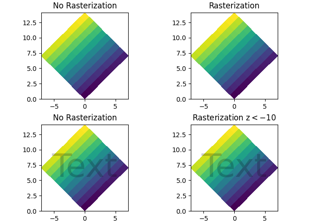
- rasterizedbool, optional
Rasterize the pcolormesh when drawing vector graphics. This can speed up rendering and produce smaller files for large data sets. See also Rasterization for vector graphics.
- Returns:
- Other Parameters:
- dataindexable object, optional
If given, all parameters also accept a string
s, which is interpreted asdata[s]ifsis a key indata.- **kwargs
Additionally, the following arguments are allowed. They are passed along to the
QuadMeshconstructor:Property
Description
a filter function, which takes a (m, n, 3) float array and a dpi value, and returns a (m, n, 3) array and two offsets from the bottom left corner of the image
array-like or float or None
bool
antialiasedoraaorantialiasedsbool or list of bools
array-like
CapStyleor {'butt', 'projecting', 'round'}(vmin: float, vmax: float)
BboxBaseor Nonebool
Patch or (Path, Transform) or None
Colormapor str or Nonecolor or list of RGBA tuples
edgecolororecoredgecolorsfacecolororfacecolorsorfcstr
{'/', '\', '|', '-', '+', 'x', 'o', 'O', '.', '*'}
unknown
bool
JoinStyleor {'miter', 'round', 'bevel'}object
linestyleordashesorlinestylesorls{'-', '--', '-.', ':', '', ...} or (offset, on-off-seq) or list thereof
linewidthorlinewidthsorlwfloat or list of floats
bool
Normalizeor str or None(N, 2) or (2,) array-like
list of
AbstractPathEffectNone or bool or float or callable
float
bool
(scale: float, length: float, randomness: float)
bool or None
str
list of str or None
bool
float
See also
pcolorAn alternative implementation with slightly different features. For a detailed discussion on the differences see Differences between pcolor() and pcolormesh().
imshowIf X and Y are each equidistant,
imshowcan be a faster alternative.
Notes
Masked arrays
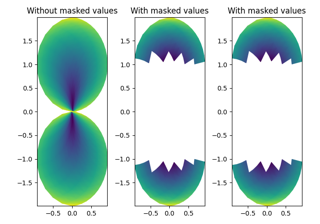
C may be a masked array. If
C[i, j]is masked, the corresponding quadrilateral will be transparent. Masking of X and Y is not supported. Usepcolorif you need this functionality.Grid orientation
The grid orientation follows the standard matrix convention: An array C with shape (nrows, ncolumns) is plotted with the column number as X and the row number as Y.
Differences between pcolor() and pcolormesh()
Both methods are used to create a pseudocolor plot of a 2D array using quadrilaterals.
The main difference lies in the created object and internal data handling: While
pcolorreturns aPolyQuadMesh,pcolormeshreturns aQuadMesh. The latter is more specialized for the given purpose and thus is faster. It should almost always be preferred.There is also a slight difference in the handling of masked arrays. Both
pcolorandpcolormeshsupport masked arrays for C. However, onlypcolorsupports masked arrays for X and Y. The reason lies in the internal handling of the masked values.pcolorleaves out the respective polygons from the PolyQuadMesh.pcolormeshsets the facecolor of the masked elements to transparent. You can see the difference when using edgecolors. While all edges are drawn irrespective of masking in a QuadMesh, the edge between two adjacent masked quadrilaterals inpcoloris not drawn as the corresponding polygons do not exist in the PolyQuadMesh. Because PolyQuadMesh draws each individual polygon, it also supports applying hatches and linestyles to the collection.Another difference is the support of Gouraud shading in
pcolormesh, which is not available withpcolor.