matplotlib.pyplot.subplot_mosaic#
- matplotlib.pyplot.subplot_mosaic(mosaic, *, sharex=False, sharey=False, width_ratios=None, height_ratios=None, empty_sentinel='.', subplot_kw=None, gridspec_kw=None, per_subplot_kw=None, **fig_kw)[source]#
Build a layout of Axes based on ASCII art or nested lists.
This is a helper function to build complex GridSpec layouts visually.
See Complex and semantic figure composition (subplot_mosaic) for an example and full API documentation
- Parameters:
- mosaiclist of list of {hashable or nested} or str
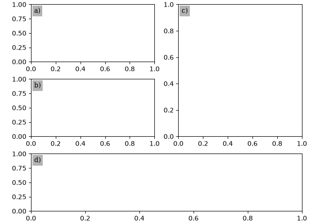
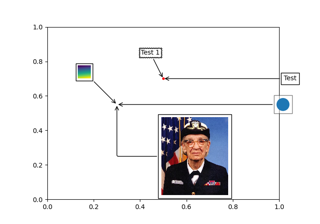
A visual layout of how you want your Axes to be arranged labeled as strings. For example
x = [['A panel', 'A panel', 'edge'],
     ['C panel', '.',       'edge']]
produces 4 Axes:
'A panel' which is 1 row high and spans the first two columns
'edge' which is 2 rows high and is on the right edge
'C panel' which in 1 row and 1 column wide in the bottom left
a blank space 1 row and 1 column wide in the bottom center
Any of the entries in the layout can be a list of lists of the same form to create nested layouts.
If input is a str, then it must be of the form
'''
AAE
C.E
'''
where each character is a column and each line is a row. This only allows only single character Axes labels and does not allow nesting but is very terse.
- sharex, shareybool, default: False
If True, the x-axis (sharex) or y-axis (sharey) will be shared among all subplots. In that case, tick label visibility and axis units behave as for
subplots. If False, each subplot's x- or y-axis will be independent.- width_ratiosarray-like of length ncols, optional
Defines the relative widths of the columns. Each column gets a relative width of
width_ratios[i] / sum(width_ratios). If not given, all columns will have the same width. Convenience forgridspec_kw={'width_ratios': [...]}.- height_ratiosarray-like of length nrows, optional
Defines the relative heights of the rows. Each row gets a relative height of
height_ratios[i] / sum(height_ratios). If not given, all rows will have the same height. Convenience forgridspec_kw={'height_ratios': [...]}.- empty_sentinelobject, optional
Entry in the layout to mean "leave this space empty". Defaults to
'.'. Note, if layout is a string, it is processed viainspect.cleandocto remove leading white space, which may interfere with using white-space as the empty sentinel.- subplot_kwdict, optional
Dictionary with keywords passed to the
Figure.add_subplotcall used to create each subplot. These values may be overridden by values in per_subplot_kw.- per_subplot_kwdict, optional
A dictionary mapping the Axes identifiers or tuples of identifiers to a dictionary of keyword arguments to be passed to the
Figure.add_subplotcall used to create each subplot. The values in these dictionaries have precedence over the values in subplot_kw.If mosaic is a string, and thus all keys are single characters, it is possible to use a single string instead of a tuple as keys; i.e.
"AB"is equivalent to("A", "B").Added in version 3.7.
- gridspec_kwdict, optional
Dictionary with keywords passed to the
GridSpecconstructor used to create the grid the subplots are placed on.- **fig_kw
All additional keyword arguments are passed to the
pyplot.figurecall.
- Returns:
- fig
Figure The new figure
- dict[label, Axes]
A dictionary mapping the labels to the Axes objects. The order of the Axes is left-to-right and top-to-bottom of their position in the total layout.
- fig
Examples using matplotlib.pyplot.subplot_mosaic#


Complex and semantic figure composition (subplot_mosaic)