matplotlib.axes.Axes.barh#
- Axes.barh(y, width, height=0.8, left=None, *, align='center', data=None, **kwargs)[source]#
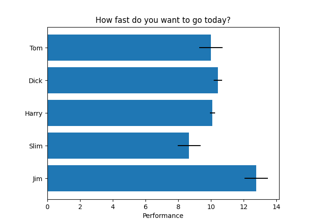
Make a horizontal bar plot.
The bars are positioned at y with the given alignment. Their dimensions are given by width and height. The horizontal baseline is left (default 0).
Many parameters can take either a single value applying to all bars or a sequence of values, one for each bar.
- Parameters:
- yfloat or array-like
The y coordinates of the bars. See also align for the alignment of the bars to the coordinates.
Bars are often used for categorical data, i.e. string labels below the bars. You can provide a list of strings directly to y.
barh(['A', 'B', 'C'], [1, 2, 3])is often a shorter and more convenient notation compared tobarh(range(3), [1, 2, 3], tick_label=['A', 'B', 'C']). They are equivalent as long as the names are unique. The explicit tick_label notation draws the names in the sequence given. However, when having duplicate values in categorical y data, these values map to the same numerical y coordinate, and hence the corresponding bars are drawn on top of each other.- widthfloat or array-like
The width(s) of the bars.
Note that if left has units (e.g. datetime), width should be in units that are a difference from the value of left (e.g. timedelta).
- heightfloat or array-like, default: 0.8
The heights of the bars.
Note that if y has units (e.g. datetime), then height should be in units that are a difference (e.g. timedelta) around the y values.
- leftfloat or array-like, default: 0
The x coordinates of the left side(s) of the bars.
Note that if left has units, then the x-axis will get a Locator and Formatter appropriate for the units (e.g. dates, or categorical).
- align{'center', 'edge'}, default: 'center'
Alignment of the base to the y coordinates*:
'center': Center the bars on the y positions.
'edge': Align the bottom edges of the bars with the y positions.
To align the bars on the top edge pass a negative height and
align='edge'.
- Returns:
BarContainerContainer with all the bars and optionally errorbars.
- Other Parameters:
- colorcolor or list of color, optional
The colors of the bar faces.
- edgecolorcolor or list of color, optional
The colors of the bar edges.
- linewidthfloat or array-like, optional
Width of the bar edge(s). If 0, don't draw edges.
- tick_labelstr or list of str, optional
The tick labels of the bars. Default: None (Use default numeric labels.)
- labelstr or list of str, optional
A single label is attached to the resulting
BarContaineras a legend label for the whole dataset. If a list is provided, it must be the same length as x and labels the individual bars. Repeated labels are not de-duplicated and will cause repeated label entries, so this is best used when bars also differ in style (e.g., by passing a list to color).Tip: Use
bar_labelto place labels on the bars.- xerr, yerrfloat or array-like of shape(N,) or shape(2, N), optional
If not None, add horizontal / vertical errorbars to the bar tips. The values are +/- sizes relative to the data:
scalar: symmetric +/- values for all bars
shape(N,): symmetric +/- values for each bar
shape(2, N): Separate - and + values for each bar. First row contains the lower errors, the second row contains the upper errors.
None: No errorbar. (default)
See Different ways of specifying error bars for an example on the usage of xerr and yerr.
- ecolorcolor or list of color, default: 'black'
The line color of the errorbars.
- capsizefloat, default:
rcParams["errorbar.capsize"](default:0.0) The length of the error bar caps in points.
- error_kwdict, optional
Dictionary of keyword arguments to be passed to the
errorbarmethod. Values of ecolor or capsize defined here take precedence over the independent keyword arguments.- logbool, default: False
If
True, set the x-axis to be log scale.- dataindexable object, optional
If given, all parameters also accept a string
s, which is interpreted asdata[s]ifsis a key indata.- **kwargs
Rectangleproperties Property
Description
a filter function, which takes a (m, n, 3) float array and a dpi value, and returns a (m, n, 3) array and two offsets from the bottom left corner of the image
float or None
unknown
bool
antialiasedoraabool or None
(left, bottom, width, height)
CapStyleor {'butt', 'projecting', 'round'}BboxBaseor Nonebool
Patch or (Path, Transform) or None
color or None
color or None
color or None
bool
str
{'/', '\', '|', '-', '+', 'x', 'o', 'O', '.', '*'}
unknown
color or 'edge' or None
unknown
bool
JoinStyleor {'miter', 'round', 'bevel'}object
{'-', '--', '-.', ':', '', ...} or (offset, on-off-seq)
float or None
bool
list of
AbstractPathEffectNone or bool or float or callable
bool
(scale: float, length: float, randomness: float)
bool or None
str
bool
unknown
unknown
(float, float)
unknown
float
Notes
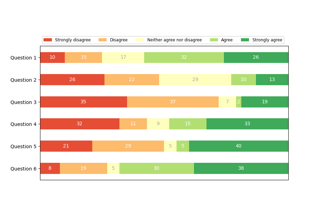
Stacked bars can be achieved by passing individual left values per bar. See Discrete distribution as horizontal bar chart.