matplotlib.axes.Axes.semilogy#
- Axes.semilogy(*args, **kwargs)[source]#
Make a plot with log scaling on the y-axis.
Call signatures:
semilogy([x], y, [fmt], data=None, **kwargs)
semilogy([x], y, [fmt], [x2], y2, [fmt2], ..., **kwargs)
This is just a thin wrapper around
plotwhich additionally changes the y-axis to log scaling. All the concepts and parameters of plot can be used here as well.The additional parameters base, subs, and nonpositive control the y-axis properties. They are just forwarded to
Axes.set_yscale.- Parameters:
- basefloat, default: 10
Base of the y logarithm.
- subsarray-like, optional
The location of the minor yticks. If None, reasonable locations are automatically chosen depending on the number of decades in the plot. See
Axes.set_yscalefor details.- nonpositive{'mask', 'clip'}, default: 'clip'
Non-positive values in y can be masked as invalid, or clipped to a very small positive number.
- **kwargs
All parameters supported by
plot.
- Returns:
- list of
Line2D Objects representing the plotted data.
- list of
Examples using matplotlib.axes.Axes.semilogy#

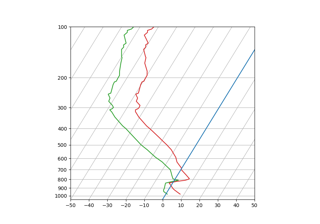
SkewT-logP diagram: using transforms and custom projections