matplotlib.axes.Axes.set_xlim#

Axes.set_xlim(left=None, right=None, *, emit=True, auto=False, xmin=None, xmax=None)[source]#

Set the x-axis view limits.

Parameters:
leftfloat, optional

The left xlim in data coordinates. Passing None leaves the limit unchanged.

The left and right xlims may also be passed as the tuple (left, right) as the first positional argument (or as the left keyword argument).

rightfloat, optional

The right xlim in data coordinates. Passing None leaves the limit unchanged.

emitbool, default: True

Whether to notify observers of limit change.

autobool or None, default: False

Whether to turn on autoscaling of the x-axis. True turns on, False turns off, None leaves unchanged.

xmin, xmaxfloat, optional

They are equivalent to left and right respectively, and it is an error to pass both xmin and left or xmax and right.

Returns:
left, right(float, float)

The new x-axis limits in data coordinates.

Notes

The left value may be greater than the right value, in which case the x-axis values will decrease from left to right.

Examples

>>> set_xlim(left, right)
>>> set_xlim((left, right))
>>> left, right = set_xlim(left, right)

One limit may be left unchanged.

>>> set_xlim(right=right_lim)

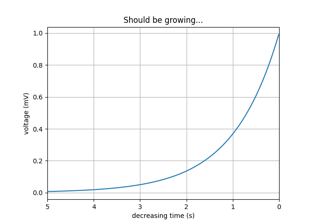
Limits may be passed in reverse order to flip the direction of the x-axis. For example, suppose x represents the number of years before present. The x-axis limits might be set like the following so 5000 years ago is on the left of the plot and the present is on the right.

>>> set_xlim(5000, 0)

Examples using matplotlib.axes.Axes.set_xlim#
Bar Label Demo

Bar Label Demo

Broken Barh

Broken Barh

Cross spectral density (CSD)

Cross spectral density (CSD)

EventCollection Demo

EventCollection Demo

Markevery Demo

Markevery Demo

Contouring the solution space of optimizations

Contouring the solution space of optimizations

Image nonuniform

Image nonuniform

pcolormesh grids and shading

pcolormesh grids and shading

Spectrogram

Spectrogram

Axes box aspect

Axes box aspect

Axes Demo

Axes Demo

Invert Axes

Invert Axes

Boxplots

Boxplots

Violin plot customization

Violin plot customization

Including upper and lower limits in error bars

Including upper and lower limits in error bars

Bar of pie

Bar of pie

Annotate Transform

Annotate Transform

AnnotationBbox demo

AnnotationBbox demo

Using a text as a Path

Using a text as a Path

Text Rotation Relative To Line

Text Rotation Relative To Line

Mmh Donuts!!!

Mmh Donuts!!!

Plotting multiple lines with a LineCollection

Plotting multiple lines with a LineCollection

Inset locator demo 2

Inset locator demo 2

Parasite Simple2

Parasite Simple2

Simple Axis Pad

Simple Axis Pad

Anatomy of a figure

Anatomy of a figure

Stock prices over 32 years

Stock prices over 32 years

XKCD

XKCD

Decay

Decay

Rain simulation

Rain simulation

Animated scatter saved as GIF

Animated scatter saved as GIF

Path editor

Path editor

Poly Editor

Poly Editor

Resampling Data

Resampling Data

Zoom Window

Zoom Window

Custom projection

Custom projection

SVG Filter Line

SVG Filter Line

TickedStroke patheffect

TickedStroke patheffect

Plot 2D data on 3D plot

Plot 2D data on 3D plot

Draw flat objects in 3D plot

Draw flat objects in 3D plot

Text annotations in 3D

Text annotations in 3D

Asinh Demo

Asinh Demo

Loglog Aspect

Loglog Aspect

Scales

Scales

Ishikawa Diagram

Ishikawa Diagram

SkewT-logP diagram: using transforms and custom projections

SkewT-logP diagram: using transforms and custom projections

Formatting date ticks using ConciseDateFormatter

Formatting date ticks using ConciseDateFormatter

Date Demo Convert

Date Demo Convert

Date tick locators and formatters

Date tick locators and formatters

Multilevel (nested) ticks

Multilevel (nested) ticks

Annotation with units

Annotation with units

Artist tests

Artist tests

Annotated cursor

Annotated cursor

Cursor

Cursor

Span Selector

Span Selector

Annotate Text Arrow

Annotate Text Arrow

Path Tutorial

Path Tutorial

Transformations Tutorial

Transformations Tutorial
Axis scales
Axis scales

Axis ticks

Axis ticks

Specifying colors

Specifying colors

Choosing Colormaps in Matplotlib

Choosing Colormaps in Matplotlib