Note
Go to the end to download the full example code.
Resampling Data#
Downsampling lowers the sample rate or sample size of a signal. In this tutorial, the signal is downsampled when the plot is adjusted through dragging and zooming.
Note
This example exercises the interactive capabilities of Matplotlib, and this will not appear in the static documentation. Please run this code on your machine to see the interactivity.
You can copy and paste individual parts, or download the entire example using the link at the bottom of the page.
import matplotlib.pyplot as plt
import numpy as np
# A class that will downsample the data and recompute when zoomed.
class DataDisplayDownsampler:
def __init__(self, xdata, y1data, y2data):
self.origY1Data = y1data
self.origY2Data = y2data
self.origXData = xdata
self.max_points = 50
self.delta = xdata[-1] - xdata[0]
def plot(self, ax):
x, y1, y2 = self._downsample(self.origXData.min(), self.origXData.max())
(self.line,) = ax.plot(x, y1, 'o-')
self.poly_collection = ax.fill_between(x, y1, y2, step="pre", color="r")
def _downsample(self, xstart, xend):
# get the points in the view range
mask = (self.origXData > xstart) & (self.origXData < xend)
# dilate the mask by one to catch the points just outside
# of the view range to not truncate the line
mask = np.convolve([1, 1, 1], mask, mode='same').astype(bool)
# sort out how many points to drop
ratio = max(np.sum(mask) // self.max_points, 1)
# mask data
xdata = self.origXData[mask]
y1data = self.origY1Data[mask]
y2data = self.origY2Data[mask]
# downsample data
xdata = xdata[::ratio]
y1data = y1data[::ratio]
y2data = y2data[::ratio]
print(f"using {len(y1data)} of {np.sum(mask)} visible points")
return xdata, y1data, y2data
def update(self, ax):
# Update the artists
lims = ax.viewLim
if abs(lims.width - self.delta) > 1e-8:
self.delta = lims.width
xstart, xend = lims.intervalx
x, y1, y2 = self._downsample(xstart, xend)
self.line.set_data(x, y1)
self.poly_collection.set_data(x, y1, y2, step="pre")
ax.figure.canvas.draw_idle()
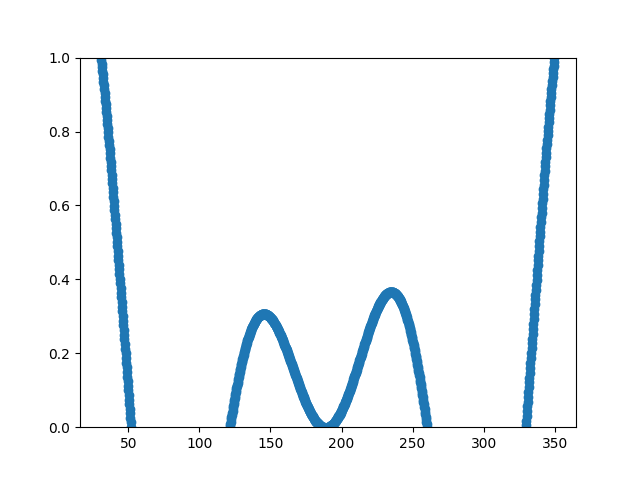
# Create a signal
xdata = np.linspace(16, 365, (365-16)*4)
y1data = np.sin(2*np.pi*xdata/153) + np.cos(2*np.pi*xdata/127)
y2data = y1data + .2
d = DataDisplayDownsampler(xdata, y1data, y2data)
fig, ax = plt.subplots()
# Hook up the line
d.plot(ax)
ax.set_autoscale_on(False) # Otherwise, infinite loop
# Connect for changing the view limits
ax.callbacks.connect('xlim_changed', d.update)
ax.set_xlim(16, 365)
plt.show()
using 52 of 1396 visible points