Note
Go to the end to download the full example code.
Demo CurveLinear Grid2#
Custom grid and ticklines.
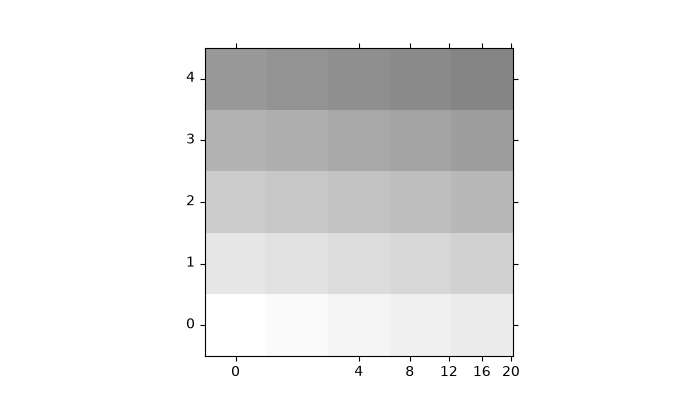
This example demonstrates how to use GridHelperCurveLinear to define custom grids and ticklines by applying a transformation on the grid. As showcase on the plot, a 5x5 matrix is displayed on the Axes.
import matplotlib.pyplot as plt
import numpy as np

from mpl_toolkits.axisartist.axislines import Axes
from mpl_toolkits.axisartist.grid_finder import ExtremeFinderSimple, MaxNLocator
from mpl_toolkits.axisartist.grid_helper_curvelinear import GridHelperCurveLinear


def curvelinear_test1(fig):
    """Grid for custom transform."""

    def tr(x, y):
        return np.sign(x)*abs(x)**.5, y

    def inv_tr(x, y):
        return np.sign(x)*x**2, y

    grid_helper = GridHelperCurveLinear(
        (tr, inv_tr),
        extreme_finder=ExtremeFinderSimple(20, 20),
        # better tick density
        grid_locator1=MaxNLocator(nbins=6), grid_locator2=MaxNLocator(nbins=6))

    ax1 = fig.add_subplot(axes_class=Axes, grid_helper=grid_helper)
    # ax1 will have a ticks and gridlines defined by the given
    # transform (+ transData of the Axes). Note that the transform of the Axes
    # itself (i.e., transData) is not affected by the given transform.

    ax1.imshow(np.arange(25).reshape(5, 5),
               vmax=50, cmap="gray_r", origin="lower")


if __name__ == "__main__":
    fig = plt.figure(figsize=(7, 4))
    curvelinear_test1(fig)
    plt.show()