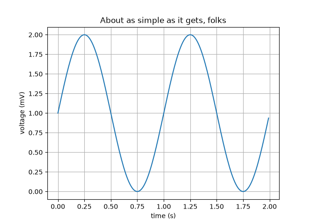
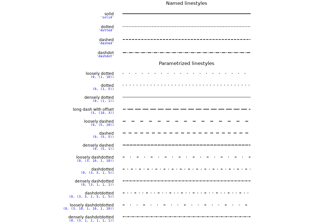
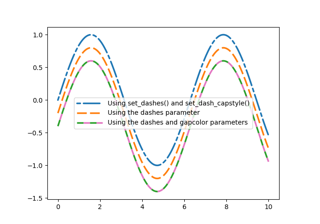
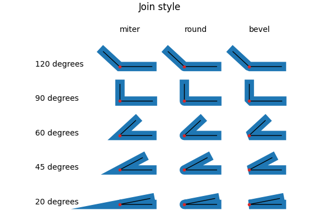
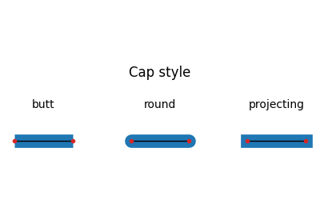
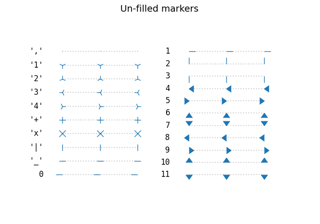
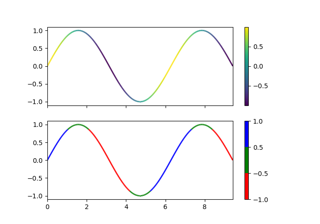
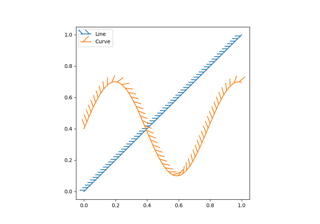
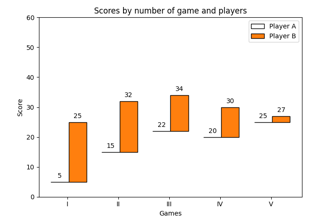
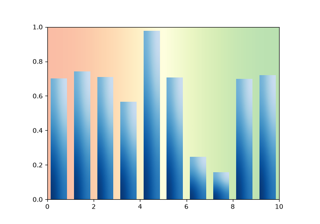
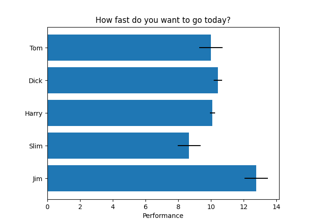
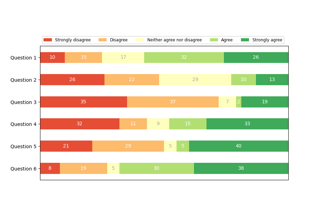
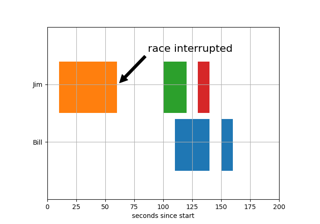
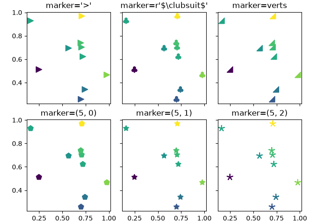
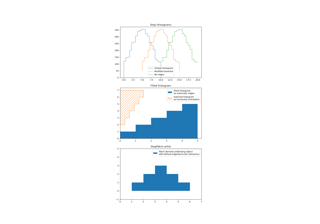
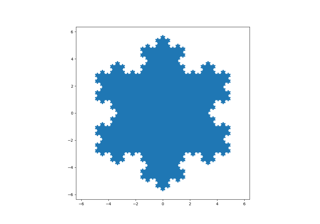
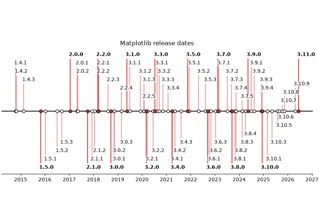
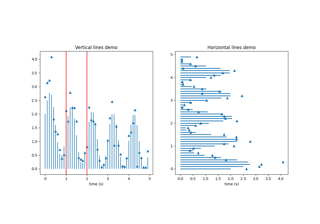
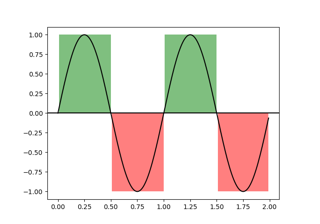
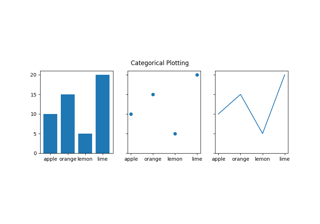
Lines, bars and markers# Line plot Line plot Linestyles Linestyles Dashed line style configuration Dashed line style configuration Markevery Demo Markevery Demo JoinStyle JoinStyle CapStyle CapStyle Marker reference Marker reference Infinite lines Infinite lines Multicolored lines Multicolored lines Lines with a ticked patheffect Lines with a ticked patheffect Grouped bar chart with labels Grouped bar chart with labels Bar chart with labels Bar chart with labels Stacked bar chart Stacked bar chart Bar chart with individual bar colors Bar chart with individual bar colors Hat graph Hat graph Bar chart with gradients Bar chart with gradients Horizontal bar chart Horizontal bar chart Discrete distribution as horizontal bar chart Discrete distribution as horizontal bar chart Broken horizontal bars Broken horizontal bars Scatter Demo2 Scatter Demo2 Mapping marker properties to multivariate data Mapping marker properties to multivariate data Marker examples Marker examples Scatter plot with a legend Scatter plot with a legend Scatter plot with masked values Scatter plot with masked values Scatter plot with histograms Scatter plot with histograms Stairs Demo Stairs Demo Step Demo Step Demo Filled polygon Filled polygon fill_between with transparency fill_between with transparency Fill the area between two lines Fill the area between two lines Fill the area between two vertical lines Fill the area between two vertical lines Stackplots and streamgraphs Stackplots and streamgraphs EventCollection Demo EventCollection Demo Eventplot demo Eventplot demo Timeline with lines, dates, and text Timeline with lines, dates, and text hlines and vlines hlines and vlines Shade regions defined by a logical mask using fill_between Shade regions defined by a logical mask using fill_between Stem plot Stem plot Plotting categorical variables Plotting categorical variables Plotting masked and NaN values Plotting masked and NaN values Spectrum representations Spectrum representations