Note
Go to the end to download the full example code.
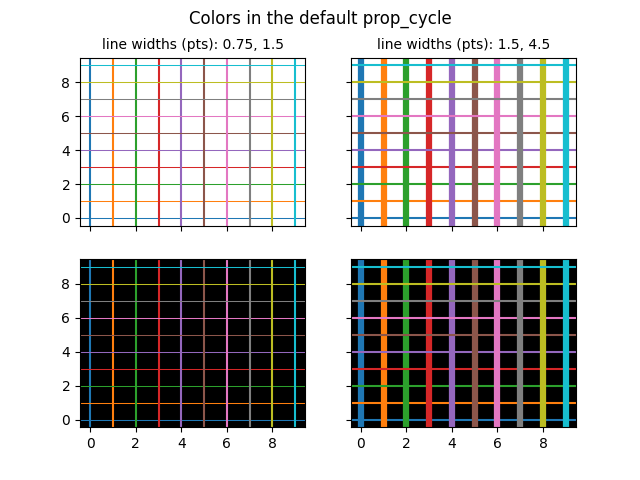
Colors in the default property cycle#
Display the colors from the default prop_cycle, which is obtained from the rc parameters.
import matplotlib.pyplot as plt
import numpy as np

from matplotlib.colors import TABLEAU_COLORS, same_color


def f(x, a):
    """A nice sigmoid-like parametrized curve, ending approximately at *a*."""
    return 0.85 * a * (1 / (1 + np.exp(-x)) + 0.2)


fig, ax = plt.subplots()
ax.axis('off')
ax.set_title("Colors in the default property cycle")

prop_cycle = plt.rcParams['axes.prop_cycle']
colors = prop_cycle.by_key()['color']
x = np.linspace(-4, 4, 200)

for i, (color, color_name) in enumerate(zip(colors, TABLEAU_COLORS)):
    assert same_color(color, color_name)
    pos = 4.5 - i
    ax.plot(x, f(x, pos))
    ax.text(4.2, pos, f"'C{i}': '{color_name}'", color=color, va="center")
    ax.bar(9, 1, width=1.5, bottom=pos-0.5)

plt.show()
References
The use of the following functions, methods, classes and modules is shown in this example: