Note
Go to the end to download the full example code.
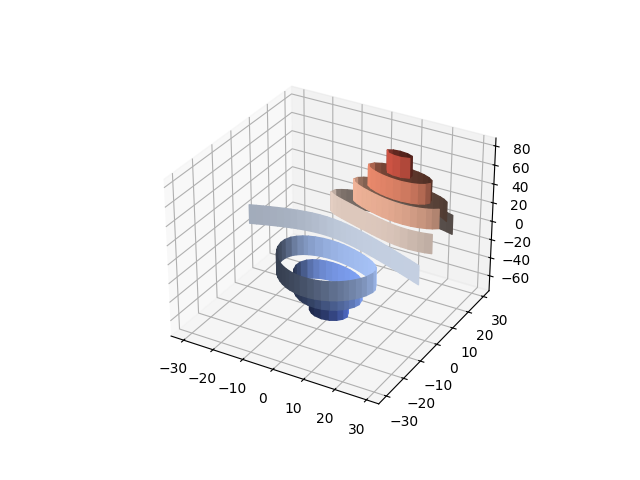
Plot contour (level) curves in 3D using the extend3d option#
This modification of the Plot contour (level) curves in 3D example uses extend3d=True to
extend the curves vertically into 'ribbons'.
import matplotlib.pyplot as plt

from mpl_toolkits.mplot3d import axes3d

ax = plt.figure().add_subplot(projection='3d')
X, Y, Z = axes3d.get_test_data(0.05)
ax.contour(X, Y, Z, extend3d=True, cmap="coolwarm")

plt.show()