mpl_toolkits.mplot3d.axes3d.Axes3D#
- class mpl_toolkits.mplot3d.axes3d.Axes3D(fig, rect=None, *args, elev=30, azim=-60, roll=0, shareview=None, sharez=None, proj_type='persp', focal_length=None, box_aspect=None, computed_zorder=True, **kwargs)[source]#
Bases:
Axes3D Axes object.
Note
As a user, you do not instantiate Axes directly, but use Axes creation methods instead; e.g. from
pyplotorFigure:subplots,subplot_mosaicorFigure.add_axes.Note
Some of the inherited behavior of Axes is not applicable to 3d and will raise an
UnsupportedError.- Parameters:
- figFigure
The parent figure.
- recttuple (left, bottom, width, height), default: (0, 0, 1, 1)
The
(left, bottom, width, height)Axes position.- elevfloat, default: 30
The elevation angle in degrees rotates the camera above and below the x-y plane, with a positive angle corresponding to a location above the plane.
- azimfloat, default: -60
The azimuthal angle in degrees rotates the camera about the z axis, with a positive angle corresponding to a right-handed rotation. In other words, a positive azimuth rotates the camera about the origin from its location along the +x axis towards the +y axis.
- rollfloat, default: 0
The roll angle in degrees rotates the camera about the viewing axis. A positive angle spins the camera clockwise, causing the scene to rotate counter-clockwise.
- shareviewAxes3D, optional
Other Axes to share view angles with. Note that it is not possible to unshare axes.
- sharezAxes3D, optional
Other Axes to share z-limits with. Note that it is not possible to unshare axes.
- proj_type{'persp', 'ortho'}
The projection type, default 'persp'.
- focal_lengthfloat, default: None
For a projection type of 'persp', the focal length of the virtual camera. Must be > 0. If None, defaults to 1. For a projection type of 'ortho', must be set to either None or infinity (numpy.inf). If None, defaults to infinity. The focal length can be computed from a desired Field Of View via the equation: focal_length = 1/tan(FOV/2)
- box_aspect3-tuple of floats, default: None
Changes the physical dimensions of the Axes3D, such that the ratio of the axis lengths in display units is x:y:z. If None, defaults to 4:4:3
- computed_zorderbool, default: True
If True, the draw order is computed based on the average position along the view direction for supported artist types (currently Collections and Patches only). Set to False if you want to manually control the order in which Artists are drawn on top of each other using their zorder attribute. This can be used for fine-tuning if the automatic order does not produce the desired result. Note however, that a manual order will only be correct for a limited view angle. If the figure is rotated by the user, it will look wrong from certain angles.
- **kwargs
Other optional keyword arguments:
Property
Description
{'box', 'datalim'}
a filter function, which takes a (m, n, 3) float array and a dpi value, and returns a (m, n, 3) array and two offsets from the bottom left corner of the image
float or None
(float, float) or {'C', 'SW', 'S', 'SE', 'E', 'NE', ...}
bool
unknown
bool
unknown
unknown
unknown
Callable[[Axes, Renderer], Bbox]
bool or 'line'
3-tuple of floats or None
BboxBaseor Nonebool
Patch or (Path, Transform) or None
bool or "auto"
str
bool
object
bool
bool
unknown
list of
AbstractPathEffectNone or bool or float or callable
[left, bottom, width, height] or
Bbox{'persp', 'ortho'}
float or None
bool
(scale: float, length: float, randomness: float)
bool or None
unknown
unknown
str
bool
unknown
unknown
str
(left: float, right: float)
float greater than -0.5
{"linear", "log", "symlog", "logit", ...}
unknown
unknown
unknown
unknown
str
(bottom: float, top: float)
float greater than -0.5
{"linear", "log", "symlog", "logit", ...}
unknown
unknown
unknown
unknown
unknown
(bottom: float, top: float)
float greater than -0.5
float
{"linear", "log", "symlog", "logit", ...}
unknown
unknown
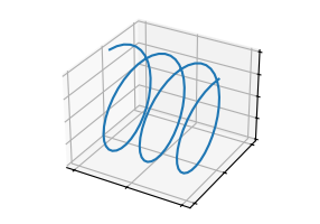
Plotting#
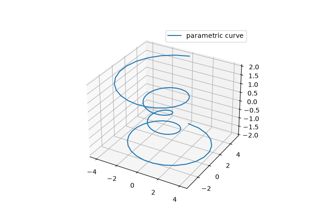
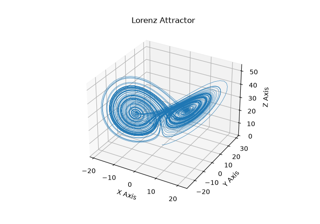
Plot 2D or 3D data. |
|
Create a scatter plot. |
|
Add 2D bar(s). |
|
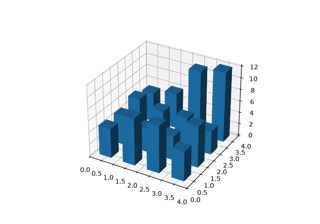
Generate a 3D barplot. |
|
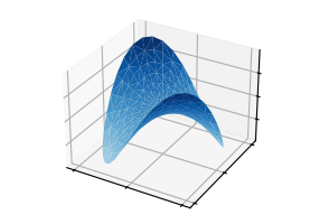
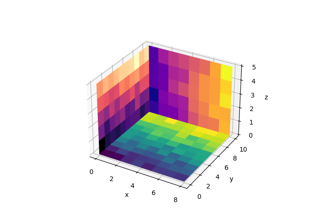
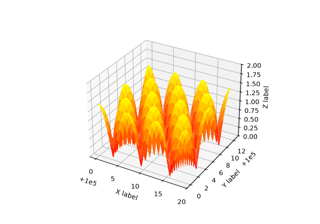
Create a surface plot. |
|
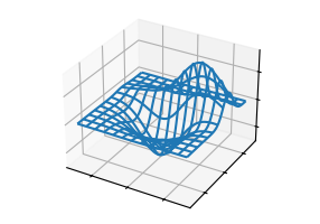
Plot a 3D wireframe. |
|
Plot a triangulated surface. |
|
Fill the area between two 3D curves. |
|
Currently not implemented for 3D Axes, and returns None. |
|
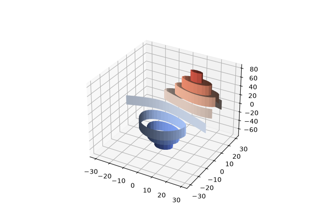
Create a 3D contour plot. |
|
Create a 3D contour plot. |
|
Create a 3D filled contour plot. |
|
Create a 3D filled contour plot. |
|
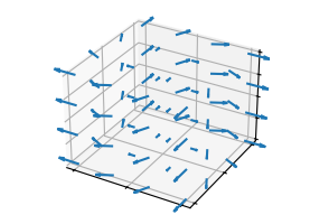
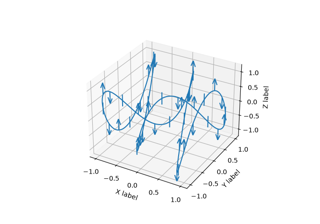
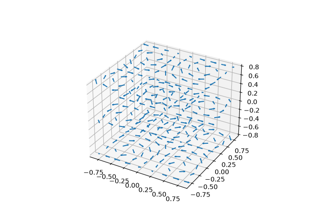
Plot a 3D field of arrows. |
|
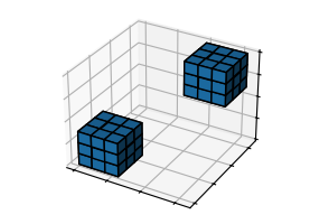
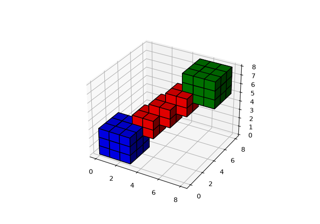
Plot a set of filled voxels |
|
Plot lines and/or markers with errorbars around them. |
|
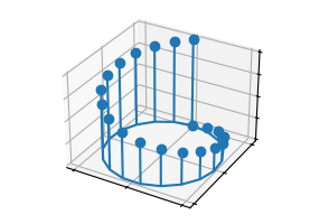
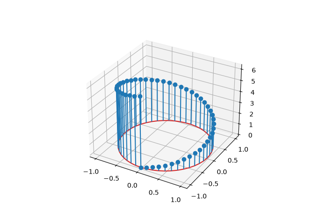
Create a 3D stem plot. |
Text and annotations#
Clearing#
Clear the Axes. |
Appearance#
Hide all visual components of the x- and y-axis. |
|
Do not hide all visual components of the x- and y-axis. |
|
Set / unset 3D grid. |
Axis#
Axis limits and direction#
Return the |
|
Return the x-axis view limits. |
|
Set the 3D x-axis view limits. |
|
Return the y-axis view limits. |
|
Set the 3D y-axis view limits. |
|
Return the 3D z-axis view limits. |
|
Set the 3D z-axis view limits. |
|
Get 3D world limits. |
|
Return whether the xaxis is oriented in the "inverse" direction. |
|
Set whether the xaxis is oriented in the "inverse" direction. |
|
[Discouraged] Invert the x-axis. |
|
[Discouraged] Return whether the xaxis is oriented in the "inverse" direction. |
|
Return whether the yaxis is oriented in the "inverse" direction. |
|
Set whether the yaxis is oriented in the "inverse" direction. |
|
[Discouraged] Invert the y-axis. |
|
[Discouraged] Return whether the yaxis is oriented in the "inverse" direction. |
|
Return whether the zaxis is oriented in the "inverse" direction. |
|
Set whether the zaxis is oriented in the "inverse" direction. |
|
[Discouraged] Invert the z-axis. |
|
[Discouraged] Return whether the zaxis is oriented in the "inverse" direction. |
|
Return the lower and upper x-axis bounds, in increasing order. |
|
Set the lower and upper numerical bounds of the x-axis. |
|
Return the lower and upper y-axis bounds, in increasing order. |
|
Set the lower and upper numerical bounds of the y-axis. |
|
Return the lower and upper z-axis bounds, in increasing order. |
|
Set the lower and upper numerical bounds of the z-axis. |
Axis labels and title#
Set zlabel. |
|
Get the z-label text string. |
|
Set a title for the Axes. |
Axis scales#
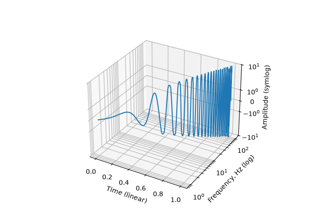
Set the x-axis scale. |
|
Set the y-axis scale. |
|
Set the z-axis scale. |
|
Return the zaxis' scale (as a str). |
Autoscaling and margins#
Retrieve autoscaling margin of the z-axis. |
|
Set padding of Z data limits prior to autoscaling. |
|
Set or retrieve autoscaling margins. |
|
Convenience method for simple axis view autoscaling. |
|
Autoscale the view limits using the data limits. |
|
Set whether the zaxis is autoscaled when drawing or by |
|
Return whether the zaxis is autoscaled. |
|
Aspect ratio#
Set the aspect ratios. |
|
Set the Axes box aspect. |
|
Adjust the Axes for a specified data aspect ratio. |
Ticks#
Convenience method for changing the appearance of ticks and tick labels. |
|
Set the zaxis' tick locations and optionally tick labels. |
|
Return the zaxis' tick locations in data coordinates. |
|
[Discouraged] Set the zaxis' tick labels with list of string labels. |
|
Return the zaxis' tick lines as a list of |
|
Return the zaxis' grid lines as a list of |
|
Return the zaxis' minor tick labels, as a list of |
|
Return the zaxis' major tick labels, as a list of |
|
Set up axis ticks and labels to treat data along the zaxis as dates. |
Units#
For artists in an Axes, if the zaxis has units support, convert z using zaxis unit type |
Adding artists#
Add a 3D collection object to the plot. |
Interactive#
Return whether this Axes supports the zoom box button functionality. |
|
Return whether this Axes supports any pan/zoom button functionality. |
|
Disable mouse buttons for 3D rotation, panning, and zooming. |
|
Set the mouse buttons for 3D rotation and zooming. |
|
Called when the mouse moves during a pan operation. |
|
Return z string formatted. |
|
Return a string giving the current view rotation angles, or the x, y, z coordinates of the point on the nearest axis pane underneath the mouse cursor, depending on the mouse button pressed. |
Projection and perspective#
Set the elevation and azimuth of the Axes in degrees (not radians). |
|
Set the projection type. |
|
Create the projection matrix from the current viewing position. |
|
Drawing#
Draw the Artist (and its children) using the given renderer. |
|
Return the tight bounding box of the Axes, including axis and their decorators (xlabel, title, etc). |
Aliases and deprecated methods#
Alias for |
|
Create a 3D stem plot. |
|
Add the text s to the 3D Axes at location x, y, z in data coordinates. |
Other#
Not implemented in |
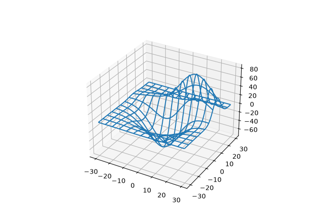
Sample 3D data#
Return a tuple X, Y, Z with a test data set. |
Examples using mpl_toolkits.mplot3d.axes3d.Axes3D#


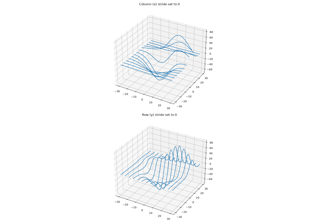
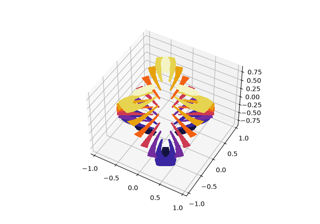
Plot contour (level) curves in 3D using the extend3d option


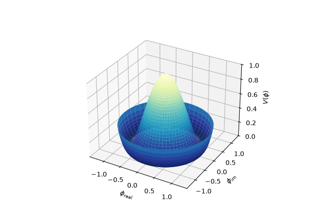


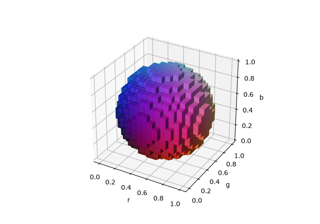
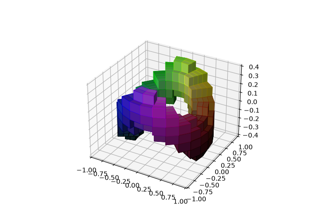
3D voxel / volumetric plot with cylindrical coordinates