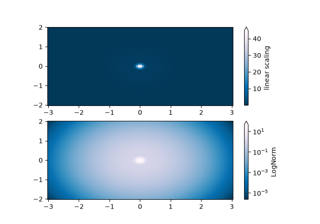
matplotlib.colors.LogNorm#
- class matplotlib.colors.LogNorm(vmin=None, vmax=None, clip=False)[source]#
Bases:
NormalizeNormalize a given value to the 0-1 range on a log scale.
- Parameters:
- vmin, vmaxfloat or None
Values within the range
[vmin, vmax]from the input data will be linearly mapped to[0, 1]. If either vmin or vmax is not provided, they default to the minimum and maximum values of the input, respectively.- clipbool, default: False
Determines the behavior for mapping values outside the range
[vmin, vmax].If clipping is off, values outside the range
[vmin, vmax]are also transformed, resulting in values outside[0, 1]. This behavior is usually desirable, as colormaps can mark these under and over values with specific colors.If clipping is on, values below vmin are mapped to 0 and values above vmax are mapped to 1. Such values become indistinguishable from regular boundary values, which may cause misinterpretation of the data.
Notes
If
vmin == vmax, input data will be mapped to 0.- __call__(value, clip=None)[source]#
Normalize the data and return the normalized data.
- Parameters:
- value
Data to normalize.
- clipbool, optional
See the description of the parameter clip in
Normalize.If
None, defaults toself.clip(which defaults toFalse).
Notes
If not already initialized,
self.vminandself.vmaxare initialized usingself.autoscale_None(value).