matplotlib.dates#
Matplotlib provides sophisticated date plotting capabilities, standing on the
shoulders of python datetime and the add-on module dateutil.
By default, Matplotlib uses the units machinery described in
units to convert datetime.datetime, and numpy.datetime64
objects when plotted on an x- or y-axis. The user does not
need to do anything for dates to be formatted, but dates often have strict
formatting needs, so this module provides many tick locators and formatters.
A basic example using numpy.datetime64 is:
import numpy as np

times = np.arange(np.datetime64('2001-01-02'),
                  np.datetime64('2002-02-03'), np.timedelta64(75, 'm'))
y = np.random.randn(len(times))

fig, ax = plt.subplots()
ax.plot(times, y)
Matplotlib date format#
Matplotlib represents dates using floating point numbers specifying the number
of days since a default epoch of 1970-01-01 UTC; for example,
1970-01-01, 06:00 is the floating point number 0.25. The formatters and
locators require the use of datetime.datetime objects, so only dates between
year 0001 and 9999 can be represented. Microsecond precision
is achievable for (approximately) 70 years on either side of the epoch, and
20 microseconds for the rest of the allowable range of dates (year 0001 to
9999). The epoch can be changed at import time via dates.set_epoch or
rcParams["date.epoch"] (default: '1970-01-01T00:00:00') to other dates if necessary; see
Date precision and epochs for a discussion.
Note
Before Matplotlib 3.3, the epoch was 0000-12-31 which lost modern microsecond precision and also made the default axis limit of 0 an invalid datetime. In 3.3 the epoch was changed as above. To convert old ordinal floats to the new epoch, users can do:
new_ordinal = old_ordinal + mdates.date2num(np.datetime64('0000-12-31'))
There are a number of helper functions to convert between datetime
objects and Matplotlib dates:
Convert a date string to a datenum using |
|
Convert datetime objects to Matplotlib dates. |
|
Convert Matplotlib dates to |
|
Convert number of days to a |
|
Return a sequence of equally spaced Matplotlib dates. |
|
Set the epoch (origin for dates) for datetime calculations. |
|
Get the epoch used by |
Note
Like Python's datetime.datetime, Matplotlib uses the Gregorian calendar
for all conversions between dates and floating point numbers. This practice
is not universal, and calendar differences can cause confusing
differences between what Python and Matplotlib give as the number of days
since 0001-01-01 and what other software and databases yield. For
example, the US Naval Observatory uses a calendar that switches
from Julian to Gregorian in October, 1582. Hence, using their
calculator, the number of days between 0001-01-01 and 2006-04-01 is
732403, whereas using the Gregorian calendar via the datetime
module we find:
In [1]: date(2006, 4, 1).toordinal() - date(1, 1, 1).toordinal()
Out[1]: 732401
All the Matplotlib date converters, locators and formatters are timezone aware.
If no explicit timezone is provided, rcParams["timezone"] (default: 'UTC') is assumed, provided as a
string. If you want to use a different timezone, pass the tz keyword
argument of num2date to any date tick locators or formatters you create. This
can be either a datetime.tzinfo instance or a string with the timezone name
that can be parsed by gettz.
A wide range of specific and general purpose date tick locators and
formatters are provided in this module. See
matplotlib.ticker for general information on tick locators
and formatters. These are described below.
The dateutil module provides additional code to handle date ticking, making it easy to place ticks on any kinds of dates. See examples below.
Date tick locators#
Most of the date tick locators can locate single or multiple ticks. For example:
# import constants for the days of the week
from matplotlib.dates import MO, TU, WE, TH, FR, SA, SU

# tick on Mondays every week
loc = WeekdayLocator(byweekday=MO, tz=tz)

# tick on Mondays and Saturdays
loc = WeekdayLocator(byweekday=(MO, SA))
In addition, most of the constructors take an interval argument:
# tick on Mondays every second week
loc = WeekdayLocator(byweekday=MO, interval=2)
The rrule locator allows completely general date ticking:
# tick every 5th easter
rule = rrulewrapper(YEARLY, byeaster=1, interval=5)
loc = RRuleLocator(rule)
The available date tick locators are:
MicrosecondLocator: Locate microseconds.SecondLocator: Locate seconds.MinuteLocator: Locate minutes.HourLocator: Locate hours.DayLocator: Locate specified days of the month.WeekdayLocator: Locate days of the week, e.g., MO, TU.MonthLocator: Locate months, e.g., 7 for July.YearLocator: Locate years that are multiples of base.RRuleLocator: Locate using arrulewrapper.rrulewrapperis a simple wrapper around dateutil'sdateutil.rrulewhich allow almost arbitrary date tick specifications. See rrule example.AutoDateLocator: On autoscale, this class picks the bestDateLocator(e.g.,RRuleLocator) to set the view limits and the tick locations. If called withinterval_multiples=Trueit will make ticks line up with sensible multiples of the tick intervals. For example, if the interval is 4 hours, it will pick hours 0, 4, 8, etc. as ticks. This behaviour is not guaranteed by default.
Date formatters#
The available date formatters are:
AutoDateFormatter: attempts to figure out the best format to use. This is most useful when used with theAutoDateLocator.ConciseDateFormatter: also attempts to figure out the best format to use, and to make the format as compact as possible while still having complete date information. This is most useful when used with theAutoDateLocator.DateFormatter: usestrftimeformat strings.
- class matplotlib.dates.AutoDateFormatter(locator, tz=None, defaultfmt='%Y-%m-%d', *, usetex=None)[source]#
Bases:
FormatterA
Formatterwhich attempts to figure out the best format to use. This is most useful when used with theAutoDateLocator.AutoDateFormatterhas a.scaleddictionary that maps tick scales (the interval in days between one major tick) to format strings; this dictionary defaults toself.scaled = { DAYS_PER_YEAR: rcParams['date.autoformatter.year'], DAYS_PER_MONTH: rcParams['date.autoformatter.month'], 1: rcParams['date.autoformatter.day'], 1 / HOURS_PER_DAY: rcParams['date.autoformatter.hour'], 1 / MINUTES_PER_DAY: rcParams['date.autoformatter.minute'], 1 / SEC_PER_DAY: rcParams['date.autoformatter.second'], 1 / MUSECONDS_PER_DAY: rcParams['date.autoformatter.microsecond'], }
The formatter uses the format string corresponding to the lowest key in the dictionary that is greater or equal to the current scale. Dictionary entries can be customized:
locator = AutoDateLocator()
formatter = AutoDateFormatter(locator)
formatter.scaled[1/(24*60)] = '%M:%S' # only show min and sec
Custom callables can also be used instead of format strings. The following example shows how to use a custom format function to strip trailing zeros from decimal seconds and adds the date to the first ticklabel:
def my_format_function(x, pos=None):
    x = matplotlib.dates.num2date(x)
    if pos == 0:
        fmt = '%D %H:%M:%S.%f'
    else:
        fmt = '%H:%M:%S.%f'
    label = x.strftime(fmt)
    label = label.rstrip("0")
    label = label.rstrip(".")
    return label

formatter.scaled[1/(24*60)] = my_format_function
Autoformat the date labels.
- Parameters:
- locator
ticker.Locator Locator that this axis is using.
- tzstr or
tzinfo, default:rcParams["timezone"](default:'UTC') Ticks timezone. If a string, tz is passed to
dateutil.tz.- defaultfmtstr
The default format to use if none of the values in
self.scaledare greater than the unit returned bylocator._get_unit().- usetexbool, default:
rcParams["text.usetex"](default:False) To enable/disable the use of TeX's math mode for rendering the results of the formatter. If any entries in
self.scaledare set as functions, then it is up to the customized function to enable or disable TeX's math mode itself.
- locator
- class matplotlib.dates.AutoDateLocator(tz=None, minticks=5, maxticks=None, interval_multiples=True)[source]#
Bases:
DateLocatorOn autoscale, this class picks the best
DateLocatorto set the view limits and the tick locations.- Attributes:
- intervalddict
Mapping of tick frequencies to multiples allowed for that ticking. The default is
self.intervald = {
    YEARLY  : [1, 2, 4, 5, 10, 20, 40, 50, 100, 200, 400, 500,
               1000, 2000, 4000, 5000, 10000],
    MONTHLY : [1, 2, 3, 4, 6],
    DAILY   : [1, 2, 3, 7, 14, 21],
    HOURLY  : [1, 2, 3, 4, 6, 12],
    MINUTELY: [1, 5, 10, 15, 30],
    SECONDLY: [1, 5, 10, 15, 30],
    MICROSECONDLY: [1, 2, 5, 10, 20, 50, 100, 200, 500,
                    1000, 2000, 5000, 10000, 20000, 50000,
                    100000, 200000, 500000, 1000000],
}
where the keys are defined in
dateutil.rrule.The interval is used to specify multiples that are appropriate for the frequency of ticking. For instance, every 7 days is sensible for daily ticks, but for minutes/seconds, 15 or 30 make sense.
When customizing, you should only modify the values for the existing keys. You should not add or delete entries.
Example for forcing ticks every 3 hours:
locator = AutoDateLocator()
locator.intervald[HOURLY] = [3]  # only show every 3 hours
- Parameters:
- tzstr or
tzinfo, default:rcParams["timezone"](default:'UTC') Ticks timezone. If a string, tz is passed to
dateutil.tz.- minticksint
The minimum number of ticks desired; controls whether ticks occur yearly, monthly, etc.
- maxticksint
The maximum number of ticks desired; controls the interval between ticks (ticking every other, every 3, etc.). For fine-grained control, this can be a dictionary mapping individual rrule frequency constants (YEARLY, MONTHLY, etc.) to their own maximum number of ticks. This can be used to keep the number of ticks appropriate to the format chosen in
AutoDateFormatter. Any frequency not specified in this dictionary is given a default value.- interval_multiplesbool, default: True
Whether ticks should be chosen to be multiple of the interval, locking them to 'nicer' locations. For example, this will force the ticks to be at hours 0, 6, 12, 18 when hourly ticking is done at 6 hour intervals.
- tzstr or
- class matplotlib.dates.ConciseDateConverter(formats=None, zero_formats=None, offset_formats=None, show_offset=True, *, interval_multiples=True)[source]#
Bases:
DateConverter
- class matplotlib.dates.ConciseDateFormatter(locator, tz=None, formats=None, offset_formats=None, zero_formats=None, show_offset=True, *, usetex=None)[source]#
Bases:
FormatterA
Formatterwhich attempts to figure out the best format to use for the date, and to make it as compact as possible, but still be complete. This is most useful when used with theAutoDateLocator:>>> locator = AutoDateLocator() >>> formatter = ConciseDateFormatter(locator)
- Parameters:
- locator
ticker.Locator Locator that this axis is using.
- tzstr or
tzinfo, default:rcParams["timezone"](default:'UTC') Ticks timezone, passed to
dates.num2date.- formatslist of 6 strings, optional
Format strings for 6 levels of tick labelling: mostly years, months, days, hours, minutes, and seconds. Strings use the same format codes as
strftime. Default is['%Y', '%b', '%d', '%H:%M', '%H:%M', '%S.%f']- zero_formatslist of 6 strings, optional
Format strings for tick labels that are "zeros" for a given tick level. For instance, if most ticks are months, ticks around 1 Jan 2005 will be labeled "Dec", "2005", "Feb". The default is
['', '%Y', '%b', '%b-%d', '%H:%M', '%H:%M']- offset_formatslist of 6 strings, optional
Format strings for the 6 levels that is applied to the "offset" string found on the right side of an x-axis, or top of a y-axis. Combined with the tick labels this should completely specify the date. The default is:
['', '%Y', '%Y-%b', '%Y-%b-%d', '%Y-%b-%d', '%Y-%b-%d %H:%M']
- show_offsetbool, default: True
Whether to show the offset or not.
- usetexbool, default:
rcParams["text.usetex"](default:False) To enable/disable the use of TeX's math mode for rendering the results of the formatter.
- locator
Examples
See Format date ticks using ConciseDateFormatter
(
Source code,2x.png,png)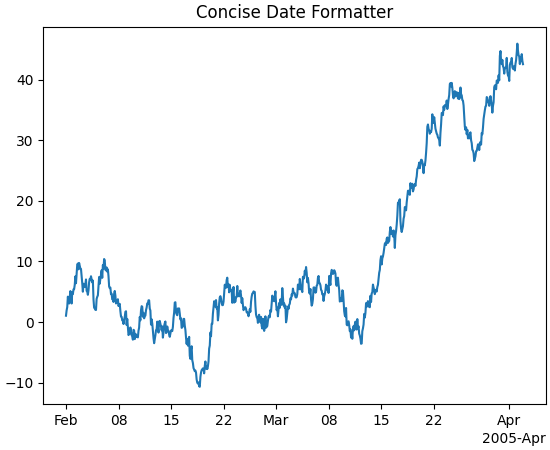
Autoformat the date labels. The default format is used to form an initial string, and then redundant elements are removed.
- format_data_short(value)[source]#
Return a short string representation of value for the mouseover tooltip (the coordinate display in the interactive figure window).
This should return concise, plain text (no mathtext / LaTeX). The precision is typically adapted to the current axis resolution so that neighbouring pixels produce distinguishable labels.
Defaults to
Formatter.format_data; subclasses should override this to provide a plain-text representation that is independent of the current tick locations.Note: The mouseover text can be customized by setting the
Axes.fmt_xdataandAxes.fmt_ydataattributes.
- format_ticks(values)[source]#
Return the tick label strings for all values.
This is the public API for generating tick labels. It calls
set_locsto configure context-dependent formatting state before delegating to__call__for each individual value.The output may contain mathtext or LaTeX markup.
Use this method (rather than
__call__) whenever formatting a complete set of tick values, so that formatters which need to see all tick locations (e.g. to determine precision, offsets, or which date components to display) can work correctly.

- class matplotlib.dates.DateConverter(*, interval_multiples=True)[source]#
Bases:
ConversionInterfaceConverter for
datetime.dateanddatetime.datetimedata, or for date/time data represented as it would be converted bydate2num.The 'unit' tag for such data is None or a
tzinfoinstance.- axisinfo(unit, axis)[source]#
Return the
AxisInfofor unit.unit is a
tzinfoinstance or None. The axis argument is required but not used.
- class matplotlib.dates.DateFormatter(fmt, tz=None, *, usetex=None)[source]#
Bases:
FormatterFormat a tick (in days since the epoch) with a
strftimeformat string.- Parameters:
- fmtstr
strftimeformat string- tzstr or
tzinfo, default:rcParams["timezone"](default:'UTC') Ticks timezone. If a string, tz is passed to
dateutil.tz.- usetexbool, default:
rcParams["text.usetex"](default:False) To enable/disable the use of TeX's math mode for rendering the results of the formatter.
- class matplotlib.dates.DateLocator(tz=None)[source]#
Bases:
LocatorDetermines the tick locations when plotting dates.
This class is subclassed by other Locators and is not meant to be used on its own.
- Parameters:
- tzstr or
tzinfo, default:rcParams["timezone"](default:'UTC') Ticks timezone. If a string, tz is passed to
dateutil.tz.
- tzstr or
- hms0d = {'byhour': 0, 'byminute': 0, 'bysecond': 0}#
- nonsingular(vmin, vmax)[source]#
Given the proposed upper and lower extent, adjust the range if it is too close to being singular (i.e. a range of ~0).
- set_tzinfo(tz)[source]#
Set timezone info.
- Parameters:
- tzstr or
tzinfo, default:rcParams["timezone"](default:'UTC') Ticks timezone. If a string, tz is passed to
dateutil.tz.
- tzstr or
- class matplotlib.dates.DayLocator(bymonthday=None, interval=1, tz=None)[source]#
Bases:
RRuleLocatorMake ticks on occurrences of each day of the month. For example, 1, 15, 30.
- Parameters:
- bymonthdayint or list of int, default: all days
Ticks will be placed on every day in bymonthday. Default is
bymonthday=range(1, 32), i.e., every day of the month.- intervalint, default: 1
The interval between each iteration. For example, if
interval=2, mark every second occurrence.- tzstr or
tzinfo, default:rcParams["timezone"](default:'UTC') Ticks timezone. If a string, tz is passed to
dateutil.tz.
- class matplotlib.dates.HourLocator(byhour=None, interval=1, tz=None)[source]#
Bases:
RRuleLocatorMake ticks on occurrences of each hour.
- Parameters:
- byhourint or list of int, default: all hours
Ticks will be placed on every hour in byhour. Default is
byhour=range(24), i.e., every hour.- intervalint, default: 1
The interval between each iteration. For example, if
interval=2, mark every second occurrence.- tzstr or
tzinfo, default:rcParams["timezone"](default:'UTC') Ticks timezone. If a string, tz is passed to
dateutil.tz.
- class matplotlib.dates.MicrosecondLocator(interval=1, tz=None)[source]#
Bases:
DateLocatorMake ticks on regular intervals of one or more microsecond(s).
Note
By default, Matplotlib uses a floating point representation of time in days since the epoch, so plotting data with microsecond time resolution does not work well for dates that are far (about 70 years) from the epoch (check with
get_epoch).If you want sub-microsecond resolution time plots, it is strongly recommended to use floating point seconds, not datetime-like time representation.
If you really must use datetime.datetime() or similar and still need microsecond precision, change the time origin via
dates.set_epochto something closer to the dates being plotted. See Date precision and epochs.- Parameters:
- intervalint, default: 1
The interval between each iteration. For example, if
interval=2, mark every second occurrence.- tzstr or
tzinfo, default:rcParams["timezone"](default:'UTC') Ticks timezone. If a string, tz is passed to
dateutil.tz.
- class matplotlib.dates.MinuteLocator(byminute=None, interval=1, tz=None)[source]#
Bases:
RRuleLocatorMake ticks on occurrences of each minute.
- Parameters:
- byminuteint or list of int, default: all minutes
Ticks will be placed on every minute in byminute. Default is
byminute=range(60), i.e., every minute.- intervalint, default: 1
The interval between each iteration. For example, if
interval=2, mark every second occurrence.- tzstr or
tzinfo, default:rcParams["timezone"](default:'UTC') Ticks timezone. If a string, tz is passed to
dateutil.tz.
- class matplotlib.dates.MonthLocator(bymonth=None, bymonthday=1, interval=1, tz=None)[source]#
Bases:
RRuleLocatorMake ticks on occurrences of each month, e.g., 1, 3, 12.
- Parameters:
- bymonthint or list of int, default: all months
Ticks will be placed on every month in bymonth. Default is
range(1, 13), i.e. every month.- bymonthdayint, default: 1
The day on which to place the ticks.
- intervalint, default: 1
The interval between each iteration. For example, if
interval=2, mark every second occurrence.- tzstr or
tzinfo, default:rcParams["timezone"](default:'UTC') Ticks timezone. If a string, tz is passed to
dateutil.tz.
- class matplotlib.dates.RRuleLocator(o, tz=None)[source]#
Bases:
DateLocator- Parameters:
- tzstr or
tzinfo, default:rcParams["timezone"](default:'UTC') Ticks timezone. If a string, tz is passed to
dateutil.tz.
- tzstr or
- class matplotlib.dates.SecondLocator(bysecond=None, interval=1, tz=None)[source]#
Bases:
RRuleLocatorMake ticks on occurrences of each second.
- Parameters:
- bysecondint or list of int, default: all seconds
Ticks will be placed on every second in bysecond. Default is
bysecond = range(60), i.e., every second.- intervalint, default: 1
The interval between each iteration. For example, if
interval=2, mark every second occurrence.- tzstr or
tzinfo, default:rcParams["timezone"](default:'UTC') Ticks timezone. If a string, tz is passed to
dateutil.tz.
- class matplotlib.dates.WeekdayLocator(byweekday=1, interval=1, tz=None)[source]#
Bases:
RRuleLocatorMake ticks on occurrences of each weekday.
- Parameters:
- byweekdayint, list of int, constant from
dateutil.rrule, or list of constants, default: 1 (Tuesday) Ticks will be placed on every weekday in byweekday. Default is every Tuesday.
Elements of byweekday (if a sequence) must be either integers or MO, TU, WE, TH, FR, SA, SU, the constants from
dateutil.rrule, which have been imported into thematplotlib.datesnamespace.- intervalint, default: 1
The interval between each iteration. For example, if
interval=2, mark every second occurrence.- tzstr or
tzinfo, default:rcParams["timezone"](default:'UTC') Ticks timezone. If a string, tz is passed to
dateutil.tz.
- byweekdayint, list of int, constant from
- class matplotlib.dates.YearLocator(base=1, month=1, day=1, tz=None)[source]#
Bases:
RRuleLocatorMake ticks on a given day of each year that is a multiple of base.
Examples:
# Tick every year on Jan 1st
locator = YearLocator()

# Tick every 5 years on July 4th
locator = YearLocator(5, month=7, day=4)
- Parameters:
- baseint, default: 1
Mark ticks every base years.
- monthint, default: 1
The month on which to place the ticks, starting from 1. Default is January.
- dayint, default: 1
The day on which to place the ticks.
- tzstr or
tzinfo, default:rcParams["timezone"](default:'UTC') Ticks timezone. If a string, tz is passed to
dateutil.tz.
- matplotlib.dates.date2num(d)[source]#
Convert datetime objects to Matplotlib dates.
- Parameters:
- d
datetime.datetimeornumpy.datetime64or sequences of these
- d
- Returns:
- float or sequence of floats
Number of days since the epoch. See
get_epochfor the epoch, which can be changed byrcParams["date.epoch"](default:'1970-01-01T00:00:00') orset_epoch. If the epoch is "1970-01-01T00:00:00" (default) then noon Jan 1 1970 ("1970-01-01T12:00:00") returns 0.5.
Notes
The Gregorian calendar is assumed; this is not universal practice. For details see the module docstring.
- matplotlib.dates.datestr2num(d, default=None)[source]#
Convert a date string to a datenum using
dateutil.parser.parse.- Parameters:
- dstr or sequence of str
The dates to convert.
- defaultdatetime.datetime, optional
The default date to use when fields are missing in d.
- matplotlib.dates.drange(dstart, dend, delta)[source]#
Return a sequence of equally spaced Matplotlib dates.
The dates start at dstart and reach up to, but not including dend. They are spaced by delta.
- Parameters:
- dstart, dend
datetime The date limits.
- delta
datetime.timedelta Spacing of the dates.
- dstart, dend
- Returns:
numpy.arrayA list floats representing Matplotlib dates.
- matplotlib.dates.get_epoch()[source]#
Get the epoch used by
dates.- Returns:
- epochstr
String for the epoch (parsable by
numpy.datetime64).
- matplotlib.dates.num2date(x, tz=None)[source]#
Convert Matplotlib dates to
datetimeobjects.- Parameters:
- xfloat or sequence of floats
Number of days (fraction part represents hours, minutes, seconds) since the epoch. See
get_epochfor the epoch, which can be changed byrcParams["date.epoch"](default:'1970-01-01T00:00:00') orset_epoch.- tzstr or
tzinfo, default:rcParams["timezone"](default:'UTC') Timezone of x. If a string, tz is passed to
dateutil.tz.
- Returns:
Notes
The Gregorian calendar is assumed; this is not universal practice. For details, see the module docstring.
- matplotlib.dates.num2timedelta(x)[source]#
Convert number of days to a
timedeltaobject.If x is a sequence, a sequence of
timedeltaobjects will be returned.- Parameters:
- xfloat, sequence of floats
Number of days. The fraction part represents hours, minutes, seconds.
- Returns:
datetime.timedeltaor list[datetime.timedelta]
- class matplotlib.dates.relativedelta(dt1=None, dt2=None, years=0, months=0, days=0, leapdays=0, weeks=0, hours=0, minutes=0, seconds=0, microseconds=0, year=None, month=None, day=None, weekday=None, yearday=None, nlyearday=None, hour=None, minute=None, second=None, microsecond=None)#
Bases:
objectThe relativedelta type is designed to be applied to an existing datetime and can replace specific components of that datetime, or represents an interval of time.
It is based on the specification of the excellent work done by M.-A. Lemburg in his mx.DateTime extension. However, notice that this type does NOT implement the same algorithm as his work. Do NOT expect it to behave like mx.DateTime's counterpart.
There are two different ways to build a relativedelta instance. The first one is passing it two date/datetime classes:
relativedelta(datetime1, datetime2)
The second one is passing it any number of the following keyword arguments:
relativedelta(arg1=x,arg2=y,arg3=z...)

year, month, day, hour, minute, second, microsecond:
    Absolute information (argument is singular); adding or subtracting a
    relativedelta with absolute information does not perform an arithmetic
    operation, but rather REPLACES the corresponding value in the
    original datetime with the value(s) in relativedelta.

years, months, weeks, days, hours, minutes, seconds, microseconds:
    Relative information, may be negative (argument is plural); adding
    or subtracting a relativedelta with relative information performs
    the corresponding arithmetic operation on the original datetime value
    with the information in the relativedelta.

weekday:
    One of the weekday instances (MO, TU, etc) available in the
    relativedelta module. These instances may receive a parameter N,
    specifying the Nth weekday, which could be positive or negative
    (like MO(+1) or MO(-2)). Not specifying it is the same as specifying
    +1. You can also use an integer, where 0=MO. This argument is always
    relative e.g. if the calculated date is already Monday, using MO(1)
    or MO(-1) won't change the day. To effectively make it absolute, use
    it in combination with the day argument (e.g. day=1, MO(1) for first
    Monday of the month).

leapdays:
    Will add given days to the date found, if year is a leap
    year, and the date found is post 28 of february.

yearday, nlyearday:
    Set the yearday or the non-leap year day (jump leap days).
    These are converted to day/month/leapdays information.
There are relative and absolute forms of the keyword arguments. The plural is relative, and the singular is absolute. For each argument in the order below, the absolute form is applied first (by setting each attribute to that value) and then the relative form (by adding the value to the attribute).
The order of attributes considered when this relativedelta is added to a datetime is:
Year
Month
Day
Hours
Minutes
Seconds
Microseconds
Finally, weekday is applied, using the rule described above.
For example
>>> from datetime import datetime
>>> from dateutil.relativedelta import relativedelta, MO
>>> dt = datetime(2018, 4, 9, 13, 37, 0)
>>> delta = relativedelta(hours=25, day=1, weekday=MO(1))
>>> dt + delta
datetime.datetime(2018, 4, 2, 14, 37)
First, the day is set to 1 (the first of the month), then 25 hours are added, to get to the 2nd day and 14th hour, finally the weekday is applied, but since the 2nd is already a Monday there is no effect.
- normalized()#
Return a version of this object represented entirely using integer values for the relative attributes.
>>> relativedelta(days=1.5, hours=2).normalized()
relativedelta(days=+1, hours=+14)
- Returns:
Returns a
dateutil.relativedelta.relativedeltaobject.
- property weeks#
- class matplotlib.dates.rrulewrapper(freq, tzinfo=None, **kwargs)[source]#
Bases:
objectA simple wrapper around a
dateutil.rruleallowing flexible date tick specifications.- Parameters:
- freq{YEARLY, MONTHLY, WEEKLY, DAILY, HOURLY, MINUTELY, SECONDLY}
Tick frequency. These constants are defined in
dateutil.rrule, but they are accessible frommatplotlib.datesas well.- tzinfo
datetime.tzinfo, optional Time zone information. The default is None.
- **kwargs
Additional keyword arguments are passed to the
dateutil.rrule.
- matplotlib.dates.set_epoch(epoch)[source]#
Set the epoch (origin for dates) for datetime calculations.
The default epoch is
rcParams["date.epoch"](default:'1970-01-01T00:00:00').If microsecond accuracy is desired, the date being plotted needs to be within approximately 70 years of the epoch. Matplotlib internally represents dates as days since the epoch, so floating point dynamic range needs to be within a factor of 2^52.
set_epochmust be called before any dates are converted (i.e. near the import section) or a RuntimeError will be raised.See also Date precision and epochs.
- Parameters:
- epochstr
valid UTC date parsable by
numpy.datetime64(do not include timezone).