matplotlib.axes.Axes.set_yscale#
- Axes.set_yscale(value, **kwargs)[source]#
Set the yaxis' scale.
- Parameters:
- valuestr or
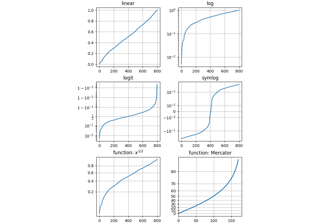
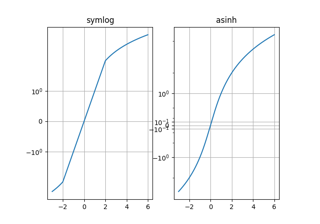
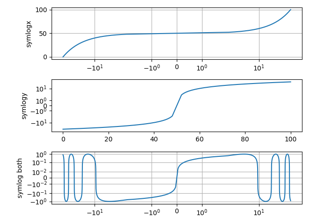
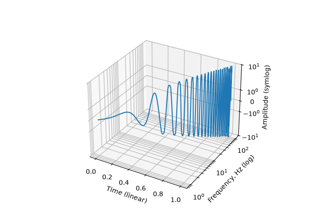
ScaleBase The axis scale type to apply. Valid string values are the names of scale classes ("linear", "log", "function",...). These may be the names of any of the built-in scales or of any custom scales registered using
matplotlib.scale.register_scale.- **kwargs
If value is a string, keywords are passed to the instantiation method of the respective class.
- valuestr or