mpl_toolkits.mplot3d.axes3d.Axes3D.tricontourf#
- Axes3D.tricontourf(*args, zdir='z', offset=None, axlim_clip=False, data=None, **kwargs)[source]#
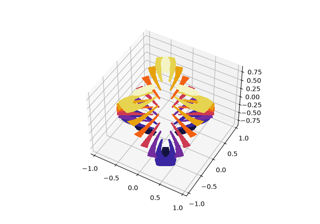
Create a 3D filled contour plot.
Note
This method currently produces incorrect output due to a longstanding bug in 3D PolyCollection rendering.
- Parameters:
- X, Y, Zarray-like
Input data. See
Axes.tricontourffor supported data shapes.- zdir{'x', 'y', 'z'}, default: 'z'
The direction to use.
- offsetfloat, optional
If specified, plot a projection of the contour lines at this position in a plane normal to zdir.
- axlim_clipbool, default: False
Whether to hide lines with a vertex outside the axes view limits.
Added in version 3.10.
- dataindexable object, optional
If given, all parameters also accept a string
s, which is interpreted asdata[s]ifsis a key indata.- *args, **kwargs
Other arguments are forwarded to
matplotlib.axes.Axes.tricontourf.
- Returns:
- matplotlib.tri._tricontour.TriContourSet