matplotlib.axis.Axis.set_major_formatter#
- Axis.set_major_formatter(formatter)[source]#
Set the formatter of the major ticker.
In addition to a
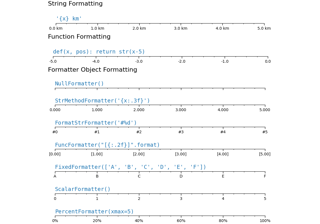
Formatterinstance, this also accepts astror function.For a
straStrMethodFormatteris used. The field used for the value must be labeled'x'and the field used for the position must be labeled'pos'. See theStrMethodFormatterdocumentation for more information.For a function, a
FuncFormatteris used. The function must take two inputs (a tick valuexand a positionpos), and return a string containing the corresponding tick label. See theFuncFormatterdocumentation for more information.- Parameters:
- formatter
Formatter,str, or function
- formatter
Examples using matplotlib.axis.Axis.set_major_formatter#
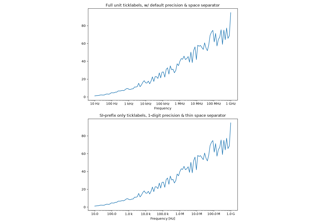

SI prefixed offsets and natural order of magnitudes
SI prefixed offsets and natural order of magnitudes

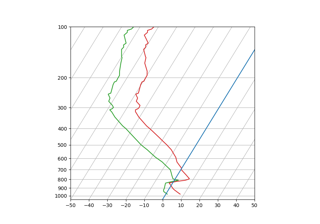
SkewT-logP diagram: using transforms and custom projections
SkewT-logP diagram: using transforms and custom projections