Note
Go to the end to download the full example code.
Multilevel (nested) ticks#
Sometimes we want another level of tick labels on an axis, perhaps to indicate a grouping of the ticks.
Matplotlib does not provide an automated way to do this, but it is relatively straightforward to annotate below the main axis.
These examples use Axes.secondary_xaxis, which is one approach. It has the
advantage that we can use Matplotlib Locators and Formatters on the axis that
does the grouping if we want.
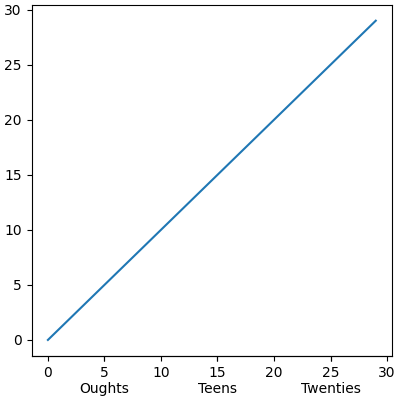
This first example creates a secondary xaxis and manually adds the ticks and
labels using Axes.set_xticks. Note that the tick labels have a newline
(e.g. "
Oughts") at the beginning of them to put the second-level tick
labels below the main tick labels.
import matplotlib.pyplot as plt
import numpy as np

import matplotlib.dates as mdates

rng = np.random.default_rng(19680801)

fig, ax = plt.subplots(layout='constrained', figsize=(4, 4))

ax.plot(np.arange(30))

sec = ax.secondary_xaxis(location=0)
sec.set_xticks([5, 15, 25], labels=['\nOughts', '\nTeens', '\nTwenties'])
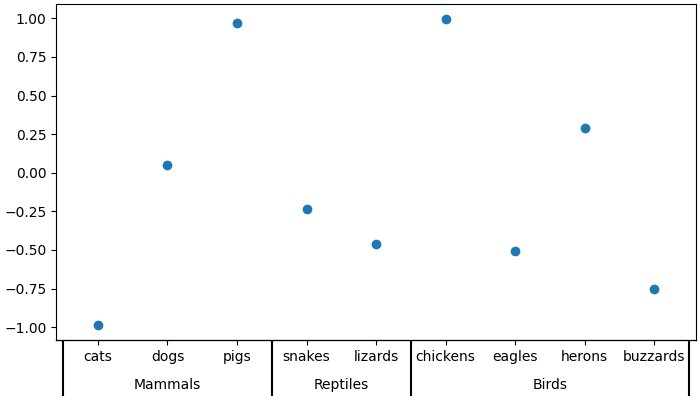
This second example adds a second level of annotation to a categorical axis.
Here we need to note that each animal (category) is assigned an integer, so
cats is at x=0, dogs at x=1 etc. Then we place the ticks on the
second level on an x that is at the middle of the animal class we are trying
to delineate.
This example also adds tick marks between the classes by adding a second secondary xaxis, and placing long, wide ticks at the boundaries between the animal classes.
fig, ax = plt.subplots(layout='constrained', figsize=(7, 4))

ax.plot(['cats', 'dogs', 'pigs', 'snakes', 'lizards', 'chickens',
         'eagles', 'herons', 'buzzards'],
        rng.normal(size=9), 'o')

# label the classes:
sec = ax.secondary_xaxis(location=0)
sec.set_xticks([1, 3.5, 6.5], labels=['\n\nMammals', '\n\nReptiles', '\n\nBirds'])
sec.tick_params('x', length=0)

# lines between the classes:
sec2 = ax.secondary_xaxis(location=0)
sec2.set_xticks([-0.5, 2.5, 4.5, 8.5], labels=[])
sec2.tick_params('x', length=40, width=1.5)
ax.set_xlim(-0.6, 8.6)
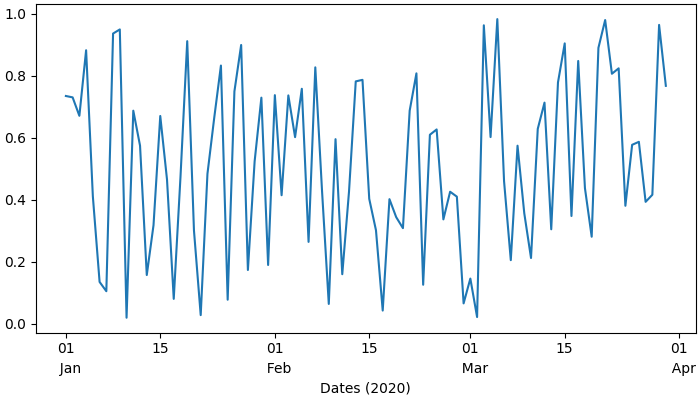
Dates are another common place where we may want to have a second level of tick labels. In this last example, we take advantage of the ability to add an automatic locator and formatter to the secondary xaxis, which means we do not need to set the ticks manually.
This example also differs from the above, in that we placed it at a location
below the main axes location=-0.075 and then we hide the spine by setting
the line width to zero. That means that our formatter no longer needs the
carriage returns of the previous two examples.
fig, ax = plt.subplots(layout='constrained', figsize=(7, 4))

time = np.arange(np.datetime64('2020-01-01'), np.datetime64('2020-03-31'),
                 np.timedelta64(1, 'D'))

ax.plot(time, rng.random(size=len(time)))

# just format the days:
ax.xaxis.set_major_formatter(mdates.DateFormatter('%d'))

# label the months:
sec = ax.secondary_xaxis(location=-0.075)
sec.xaxis.set_major_locator(mdates.MonthLocator(bymonthday=1))

# note the extra spaces in the label to align the month label inside the month.
# Note that this could have been done by changing ``bymonthday`` above as well:
sec.xaxis.set_major_formatter(mdates.DateFormatter('  %b'))
sec.tick_params('x', length=0)
sec.spines['bottom'].set_linewidth(0)

# label the xaxis, but note for this to look good, it needs to be on the
# secondary xaxis.
sec.set_xlabel('Dates (2020)')

plt.show()
Total running time of the script: (0 minutes 1.455 seconds)