Note
Go to the end to download the full example code.
Stackplots and streamgraphs#
Stackplots#
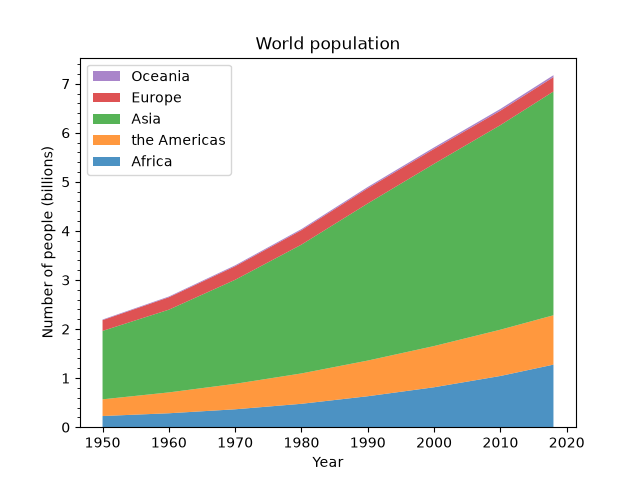
Stackplots draw multiple datasets as vertically stacked areas. This is useful when the individual data values and additionally their cumulative value are of interest.
import matplotlib.pyplot as plt
import numpy as np

import matplotlib.ticker as mticker

# data from United Nations World Population Prospects (Revision 2019)
# https://population.un.org/wpp/, license: CC BY 3.0 IGO
year = [1950, 1960, 1970, 1980, 1990, 2000, 2010, 2018]
population_by_continent = {
    'Africa': [.228, .284, .365, .477, .631, .814, 1.044, 1.275],
    'the Americas': [.340, .425, .519, .619, .727, .840, .943, 1.006],
    'Asia': [1.394, 1.686, 2.120, 2.625, 3.202, 3.714, 4.169, 4.560],
    'Europe': [.220, .253, .276, .295, .310, .303, .294, .293],
    'Oceania': [.012, .015, .019, .022, .026, .031, .036, .039],
}

fig, ax = plt.subplots()
ax.stackplot(year, population_by_continent.values(),
             labels=population_by_continent.keys(), alpha=0.8)
ax.legend(loc='upper left', reverse=True)
ax.set_title('World population')
ax.set_xlabel('Year')
ax.set_ylabel('Number of people (billions)')
# add tick at every 200 million people
ax.yaxis.set_minor_locator(mticker.MultipleLocator(.2))

plt.show()
Streamgraphs#
Using the baseline parameter, you can turn an ordinary stacked area plot with baseline 0 into a stream graph.
# Fixing random state for reproducibility
np.random.seed(19680801)


def gaussian_mixture(x, n=5):
    """Return a random mixture of *n* Gaussians, evaluated at positions *x*."""
    def add_random_gaussian(a):
        amplitude = 1 / (.1 + np.random.random())
        dx = x[-1] - x[0]
        x0 = (2 * np.random.random() - .5) * dx
        z = 10 / (.1 + np.random.random()) / dx
        a += amplitude * np.exp(-(z * (x - x0))**2)
    a = np.zeros_like(x)
    for j in range(n):
        add_random_gaussian(a)
    return a


x = np.linspace(0, 100, 101)
ys = [gaussian_mixture(x) for _ in range(3)]

fig, ax = plt.subplots()
ax.stackplot(x, ys, baseline='wiggle')
plt.show()

Total running time of the script: (0 minutes 1.037 seconds)