Note
Go to the end to download the full example code.
Annotated cursor#
Display a data cursor including a text box, which shows the plot point close to the mouse pointer.
The new cursor inherits from Cursor and demonstrates the
creation of new widgets and their event callbacks.
See also the cross hair cursor, which implements a cursor tracking the plotted data, but without using inheritance and without displaying the currently tracked coordinates.
Note
The figure related to this example does not show the cursor, because that figure is automatically created in a build queue, where the first mouse movement, which triggers the cursor creation, is missing.
import matplotlib.pyplot as plt
import numpy as np
from matplotlib.backend_bases import MouseEvent
from matplotlib.widgets import Cursor
class AnnotatedCursor(Cursor):
"""
A crosshair cursor like `~matplotlib.widgets.Cursor` with a text showing \
the current coordinates.
For the cursor to remain responsive you must keep a reference to it.
The data of the axis specified as *dataaxis* must be in ascending
order. Otherwise, the `numpy.searchsorted` call might fail and the text
disappears. You can satisfy the requirement by sorting the data you plot.
Usually the data is already sorted (if it was created e.g. using
`numpy.linspace`), but e.g. scatter plots might cause this problem.
The cursor sticks to the plotted line.
Parameters
----------
line : `matplotlib.lines.Line2D`
The plot line from which the data coordinates are displayed.
numberformat : `python format string <https://docs.python.org/3/\
library/string.html#formatstrings>`_, optional, default: "{0:.4g};{1:.4g}"
The displayed text is created by calling *format()* on this string
with the two coordinates.
offset : (float, float) default: (5, 5)
The offset in display (pixel) coordinates of the text position
relative to the cross-hair.
dataaxis : {"x", "y"}, optional, default: "x"
If "x" is specified, the vertical cursor line sticks to the mouse
pointer. The horizontal cursor line sticks to *line*
at that x value. The text shows the data coordinates of *line*
at the pointed x value. If you specify "y", it works in the opposite
manner. But: For the "y" value, where the mouse points to, there might
be multiple matching x values, if the plotted function is not biunique.
Cursor and text coordinate will always refer to only one x value.
So if you use the parameter value "y", ensure that your function is
biunique.
Other Parameters
----------------
textprops : `matplotlib.text` properties as dictionary
Specifies the appearance of the rendered text object.
**cursorargs : `matplotlib.widgets.Cursor` properties
Arguments passed to the internal `~matplotlib.widgets.Cursor` instance.
The `matplotlib.axes.Axes` argument is mandatory! The parameter
*useblit* can be set to *True* in order to achieve faster rendering.
"""
def __init__(self, line, numberformat="{0:.4g};{1:.4g}", offset=(5, 5),
dataaxis='x', textprops=None, **cursorargs):
if textprops is None:
textprops = {}
# The line object, for which the coordinates are displayed
self.line = line
# The format string, on which .format() is called for creating the text
self.numberformat = numberformat
# Text position offset
self.offset = np.array(offset)
# The axis in which the cursor position is looked up
self.dataaxis = dataaxis
# First call baseclass constructor.
# Draws cursor and remembers background for blitting.
# Saves ax as class attribute.
super().__init__(**cursorargs)
# Default value for position of text.
self.set_position(self.line.get_xdata()[0], self.line.get_ydata()[0])
# Create invisible animated text
self.text = self.ax.text(
self.ax.get_xbound()[0],
self.ax.get_ybound()[0],
"0, 0",
animated=bool(self.useblit),
visible=False, **textprops)
# The position at which the cursor was last drawn
self.lastdrawnplotpoint = None
def onmove(self, event):
"""
Overridden draw callback for cursor. Called when moving the mouse.
"""
# Leave method under the same conditions as in overridden method
if self.ignore(event):
self.lastdrawnplotpoint = None
return
if not self.canvas.widgetlock.available(self):
self.lastdrawnplotpoint = None
return
# If the mouse left drawable area, we now make the text invisible.
# Baseclass will redraw complete canvas after, which makes both text
# and cursor disappear.
if event.inaxes != self.ax:
self.lastdrawnplotpoint = None
self.text.set_visible(False)
super().onmove(event)
return
# Get the coordinates, which should be displayed as text,
# if the event coordinates are valid.
plotpoint = None
if event.xdata is not None and event.ydata is not None:
# Get plot point related to current x position.
# These coordinates are displayed in text.
plotpoint = self.set_position(event.xdata, event.ydata)
# Modify event, such that the cursor is displayed on the
# plotted line, not at the mouse pointer,
# if the returned plot point is valid
if plotpoint is not None:
event.xdata = plotpoint[0]
event.ydata = plotpoint[1]
# If the plotpoint is given, compare to last drawn plotpoint and
# return if they are the same.
# Skip even the call of the base class, because this would restore the
# background, draw the cursor lines and would leave us the job to
# re-draw the text.
if plotpoint is not None and plotpoint == self.lastdrawnplotpoint:
return
# Baseclass redraws canvas and cursor. Due to blitting,
# the added text is removed in this call, because the
# background is redrawn.
super().onmove(event)
# Check if the display of text is still necessary.
# If not, just return.
# This behaviour is also cloned from the base class.
if not self.get_active() or not self.visible:
return
# Draw the widget, if event coordinates are valid.
if plotpoint is not None:
# Update position and displayed text.
# Position: Where the event occurred.
# Text: Determined by set_position() method earlier
# Position is transformed to pixel coordinates,
# an offset is added there and this is transformed back.
temp = [event.xdata, event.ydata]
temp = self.ax.transData.transform(temp)
temp = temp + self.offset
temp = self.ax.transData.inverted().transform(temp)
self.text.set_position(temp)
self.text.set_text(self.numberformat.format(*plotpoint))
self.text.set_visible(self.visible)
# Tell base class, that we have drawn something.
# Baseclass needs to know, that it needs to restore a clean
# background, if the cursor leaves our figure context.
self.needclear = True
# Remember the recently drawn cursor position, so events for the
# same position (mouse moves slightly between two plot points)
# can be skipped
self.lastdrawnplotpoint = plotpoint
# otherwise, make text invisible
else:
self.text.set_visible(False)
# Draw changes. Cannot use _update method of baseclass,
# because it would first restore the background, which
# is done already and is not necessary.
if self.useblit:
self.ax.draw_artist(self.text)
self.canvas.blit(self.ax.bbox)
else:
# If blitting is deactivated, the overridden _update call made
# by the base class immediately returned.
# We still have to draw the changes.
self.canvas.draw_idle()
def set_position(self, xpos, ypos):
"""
Finds the coordinates, which have to be shown in text.
The behaviour depends on the *dataaxis* attribute. Function looks
up the matching plot coordinate for the given mouse position.
Parameters
----------
xpos : float
The current x position of the cursor in data coordinates.
Important if *dataaxis* is set to 'x'.
ypos : float
The current y position of the cursor in data coordinates.
Important if *dataaxis* is set to 'y'.
Returns
-------
ret : {2D array-like, None}
The coordinates which should be displayed.
*None* is the fallback value.
"""
# Get plot line data
xdata = self.line.get_xdata()
ydata = self.line.get_ydata()
# The dataaxis attribute decides, in which axis we look up which cursor
# coordinate.
if self.dataaxis == 'x':
pos = xpos
data = xdata
lim = self.ax.get_xlim()
elif self.dataaxis == 'y':
pos = ypos
data = ydata
lim = self.ax.get_ylim()
else:
raise ValueError(f"The data axis specifier {self.dataaxis} should "
f"be 'x' or 'y'")
# If position is valid and in valid plot data range.
if pos is not None and lim[0] <= pos <= lim[-1]:
# Find closest x value in sorted x vector.
# This requires the plotted data to be sorted.
index = np.searchsorted(data, pos)
# Return none, if this index is out of range.
if index < 0 or index >= len(data):
return None
# Return plot point as tuple.
return (xdata[index], ydata[index])
# Return none if there is no good related point for this x position.
return None
def clear(self, event):
"""
Overridden clear callback for cursor, called before drawing the figure.
"""
# The base class saves the clean background for blitting.
# Text and cursor are invisible,
# until the first mouse move event occurs.
super().clear(event)
if self.ignore(event):
return
self.text.set_visible(False)
def _update(self):
"""
Overridden method for either blitting or drawing the widget canvas.
Passes call to base class if blitting is activated, only.
In other cases, one draw_idle call is enough, which is placed
explicitly in this class (see *onmove()*).
In that case, `~matplotlib.widgets.Cursor` is not supposed to draw
something using this method.
"""
if self.useblit:
super()._update()
fig, ax = plt.subplots(figsize=(8, 6))
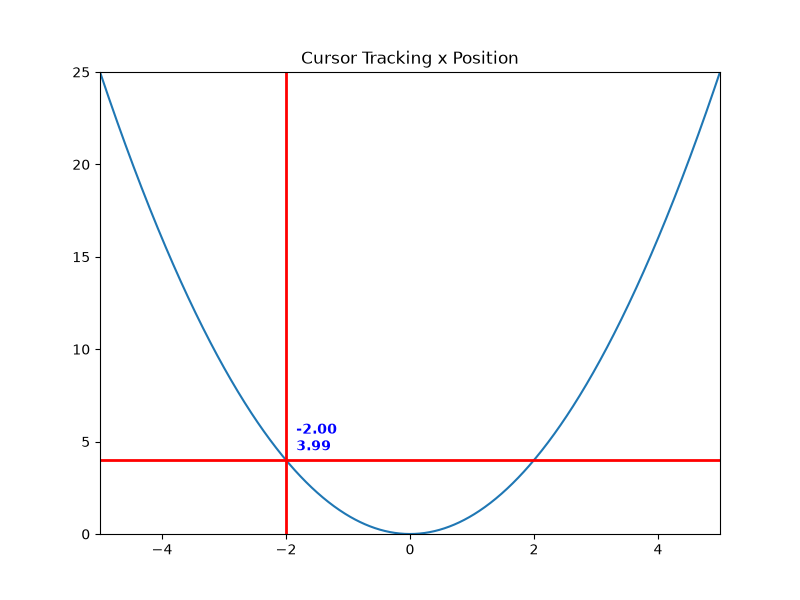
ax.set_title("Cursor Tracking x Position")
x = np.linspace(-5, 5, 1000)
y = x**2
line, = ax.plot(x, y)
ax.set_xlim(-5, 5)
ax.set_ylim(0, 25)
# A minimum call
# Set useblit=True on most backends for enhanced performance
# and pass the ax parameter to the Cursor base class.
# cursor = AnnotatedCursor(line=lin[0], ax=ax, useblit=True)
# A more advanced call. Properties for text and lines are passed.
# Watch the passed color names and the color of cursor line and text, to
# relate the passed options to graphical elements.
# The dataaxis parameter is still the default.
cursor = AnnotatedCursor(
line=line,
numberformat="{0:.2f}\n{1:.2f}",
dataaxis='x', offset=[10, 10],
textprops={'color': 'blue', 'fontweight': 'bold'},
ax=ax,
useblit=True,
color='red',
linewidth=2)
# Simulate a mouse move to (-2, 10), needed for online docs
t = ax.transData
MouseEvent(
"motion_notify_event", ax.figure.canvas, *t.transform((-2, 10))
)._process()
plt.show()
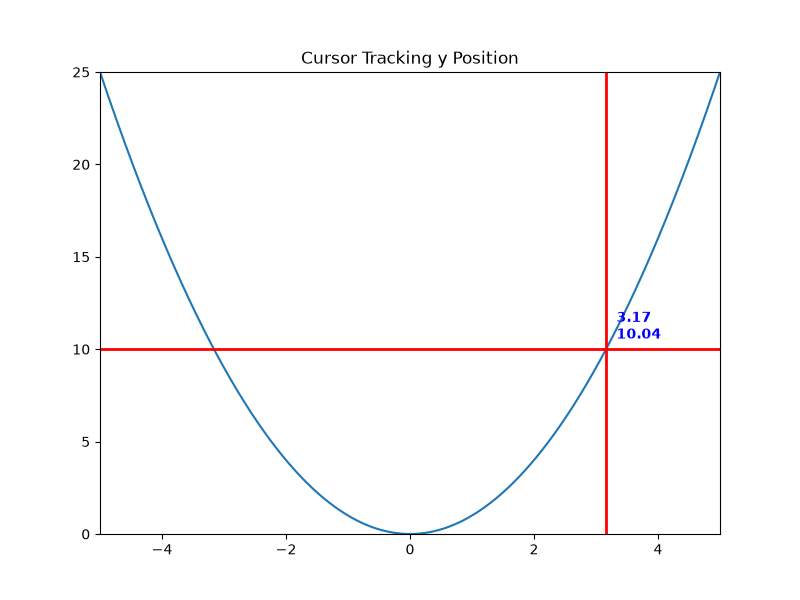
Trouble with non-biunique functions#
A call demonstrating problems with the dataaxis=y parameter. The text now looks up the matching x value for the current cursor y position instead of vice versa. Hover your cursor to y=4. There are two x values producing this y value: -2 and 2. The function is only unique, but not biunique. Only one value is shown in the text.
fig, ax = plt.subplots(figsize=(8, 6))
ax.set_title("Cursor Tracking y Position")

line, = ax.plot(x, y)
ax.set_xlim(-5, 5)
ax.set_ylim(0, 25)

cursor = AnnotatedCursor(
    line=line,
    numberformat="{0:.2f}\n{1:.2f}",
    dataaxis='y', offset=[10, 10],
    textprops={'color': 'blue', 'fontweight': 'bold'},
    ax=ax,
    useblit=True,
    color='red', linewidth=2)

# Simulate a mouse move to (-2, 10), needed for online docs
t = ax.transData
MouseEvent(
    "motion_notify_event", ax.figure.canvas, *t.transform((-2, 10))
)._process()

plt.show()