Note
Go to the end to download the full example code.
Date tick locators and formatters#
This example illustrates the usage and effect of the various date locators and formatters.
import matplotlib.pyplot as plt
import numpy as np

# While these appear unused directly, they are used from eval'd strings.
from matplotlib.dates import (FR, MO, MONTHLY, SA, SU, TH, TU, WE, AutoDateFormatter,
                              AutoDateLocator, ConciseDateFormatter, DateFormatter,
                              DayLocator, HourLocator, MicrosecondLocator,
                              MinuteLocator, MonthLocator, RRuleLocator, SecondLocator,
                              WeekdayLocator, YearLocator, rrulewrapper)
import matplotlib.ticker as ticker


def plot_axis(ax, locator=None, xmax='2002-02-01', fmt=None, formatter=None):
    """Set up common parameters for the Axes in the example."""
    ax.spines[['left', 'right', 'top']].set_visible(False)
    ax.yaxis.set_major_locator(ticker.NullLocator())
    ax.tick_params(which='major', width=1.00, length=5)
    ax.tick_params(which='minor', width=0.75, length=2.5)
    ax.set_xlim(np.datetime64('2000-02-01'), np.datetime64(xmax))
    if locator:
        ax.xaxis.set_major_locator(eval(locator))
        ax.xaxis.set_major_formatter(DateFormatter(fmt))
    else:
        ax.xaxis.set_major_formatter(eval(formatter))
    ax.text(0.0, 0.2, locator or formatter, transform=ax.transAxes,
            fontsize=14, fontname='Monospace', color='tab:blue')
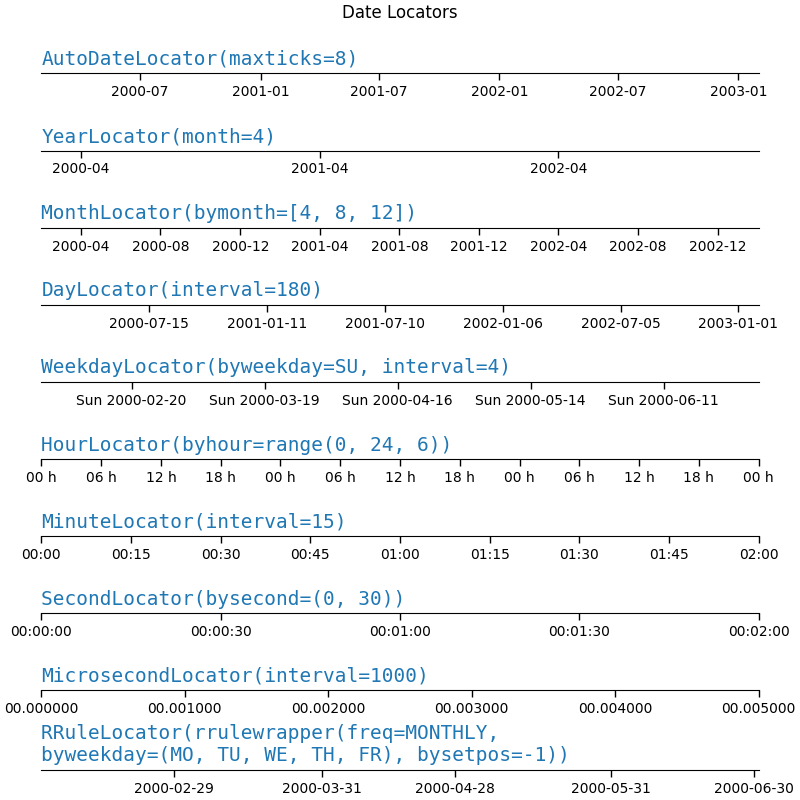
Date tick locators#
locators = [
    # locator as str, xmax, fmt
    ('AutoDateLocator(maxticks=8)', '2003-02-01', '%Y-%m'),
    ('YearLocator(month=4)', '2003-02-01', '%Y-%m'),
    ('MonthLocator(bymonth=[4, 8, 12])', '2003-02-01', '%Y-%m'),
    ('DayLocator(interval=180)', '2003-02-01', '%Y-%m-%d'),
    ('WeekdayLocator(byweekday=SU, interval=4)', '2000-07-01', '%a %Y-%m-%d'),
    ('HourLocator(byhour=range(0, 24, 6))', '2000-02-04', '%H h'),
    ('MinuteLocator(interval=15)', '2000-02-01 02:00', '%H:%M'),
    ('SecondLocator(bysecond=(0, 30))', '2000-02-01 00:02', '%H:%M:%S'),
    ('MicrosecondLocator(interval=1000)', '2000-02-01 00:00:00.005', '%S.%f'),
    ('RRuleLocator(rrulewrapper(freq=MONTHLY, \nbyweekday=(MO, TU, WE, TH, FR), '
     'bysetpos=-1))', '2000-07-01', '%Y-%m-%d'),
]

fig, axs = plt.subplots(len(locators), 1, figsize=(8, len(locators) * .8),
                        layout='constrained')
fig.suptitle('Date Locators')
for ax, (locator, xmax, fmt) in zip(axs, locators):
    plot_axis(ax, locator, xmax, fmt)
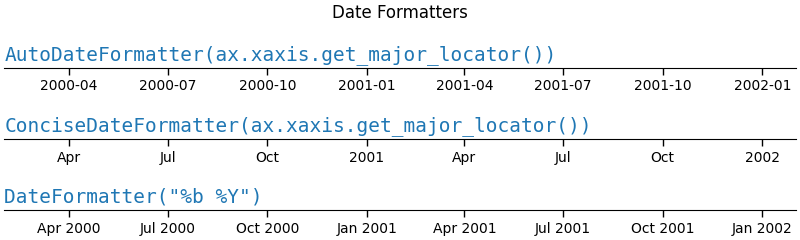
Date formatters#
formatters = [
    'AutoDateFormatter(ax.xaxis.get_major_locator())',
    'ConciseDateFormatter(ax.xaxis.get_major_locator())',
    'DateFormatter("%b %Y")',
]

fig, axs = plt.subplots(len(formatters), 1, figsize=(8, len(formatters) * .8),
                        layout='constrained')
fig.suptitle('Date Formatters')
for ax, fmt in zip(axs, formatters):
    plot_axis(ax, formatter=fmt)
References
The use of the following functions, methods, classes and modules is shown in this example:
Total running time of the script: (0 minutes 2.613 seconds)